November 2017 Market Stats: Infographic & Report

 
RLPS_Nov_Infographic_DT_Let_Dec5_2017.jpg
 

November 2017 market stats are here!

The average sale price for the month was $761,757, down 2.0% compared to November 2016.

Here’s a breakdown of the average sale prices & year-over-year increases/decreases for the 416 area code:

  • Detached = $1,276,184 (-5.1%)

  • Semi-Detached = $904,711 (-0.7%)

  • Townhouse = $760,501 (+12.3%)

  • Condo Apartment = $555,396 (+17.7%)

And here’s TREB’s official market report for the month November 2017:

Toronto Real Estate Board President Tim Syrianos announced that Greater Toronto Area REALTORS® reported 7,374 transactions through TREB's MLS® System in November 2017.

This result was up compared to October 2017, bucking the regular seasonal trend.

On a year-over-year basis, sales were down by 13.3 per cent compared to November 2016.

New listings entered into TREB's MLS® System in November 2017 amounted to 14,349 – up by 37.2 per cent compared to November 2016, when the supply of listings was very low from a historic perspective.

"We have seen an uptick in demand for ownership housing in the GTA this fall, over and above the regular seasonal trend. Similar to the Greater Vancouver experience, the impact of the Ontario Fair Housing Plan and particularly the foreign buyer tax may be starting to wane. On top of this, it is also possible that the upcoming changes to mortgage lending guidelines, which come into effect in January, have prompted some households to speed up their home buying decision," said Mr. Syrianos.

The MLS® Home Price Index (HPI) composite benchmark price was up by 8.4 per cent on a year-over-year basis in November 2017.

The average selling price for all home types combined was down by two per cent compared to November 2016, due in large part to a smaller share of detached home sales versus last year.

On a year-to-date basis, the average selling price was up by 13.4 per cent compared to the same period last year.

High density home types continued to lead the way in terms of price growth, with the average condominium apartment price up by double-digits compared to November 2016.

"Changes in market conditions have not been uniform across market segments. In line with insights from consumer polling undertaken by Ipsos in the spring, we are still seeing seller's market conditions for townhouses and condominium apartments in many neighbourhoods versus more balanced market conditions for detached and semi-detached houses. We will have more insights to share about consumer intentions for 2018 at the end of January when TREB releases its third annual Market Year in Review and Outlook report," said Jason Mercer, TREB's Director of Market Analysis.

If you’re thinking of making a move and would like to know how we can help, please contact us for more info.

October 2017 Market Stats: Infographic & Report

 
RLPS_Oct_Infographic_DT_Let_Nov3_2017.jpg
 

October 2017 market stats are here!

The average sale price for the month was $780,104, up 2.3% over October 2016.

Here’s a breakdown of the average sale prices & year-over-year increases for the 416 area code:

  • Detached = $1,287,765 (-1.1%)

  • Semi-Detached = $948,309 (+5.2%)

  • Townhouse = $742,845 (+8.0%)

  • Condo Apartment = $555,004 (+20.9%)

And here’s TREB’s official market report for the month October 2017:

Toronto Real Estate Board President Tim Syrianos reported 7,118 residential sales through TREB's MLS® System in October 2017. This result represented an above-average increase between September and October of almost 12 per cent, pointing to stronger fall market conditions.

On a year-over-year basis, October sales were down compared to 9,715 transactions in September 2016. Total sales reported through the first 10 months of 2017 amounted to 80,198 – down from 99,233 for the same time period in 2016.

"Every year we generally see a jump in sales between September and October. However, this year that increase was more pronounced than usual compared to the previous ten years. So, while the number of transactions was still down relative to last year's record pace, it certainly does appear that sales momentum is picking up," said Mr. Syrianos.

The MLS® Home Price Index Composite benchmark price was up by 9.7 per cent on a year-over-year basis in October.

Annual rates of price growth were strongest for townhouses and condominium apartments.

The average selling price for October transactions was $780,104 – up by 2.3 per cent compared to the average of $762,691 in October 2016.

"The housing market in the GTA has been impacted by a number of policy changes at the provincial and federal levels. Similar to the track followed in the Greater Vancouver Area, it appears that the psychological impact of the Fair Housing Plan, including the tax on foreign buyers, is starting to unwind," said Jason Mercer, TREB's Director of Market Analysis.

If you’re thinking of making a move and would like to know how we can help, please contact us for more info.

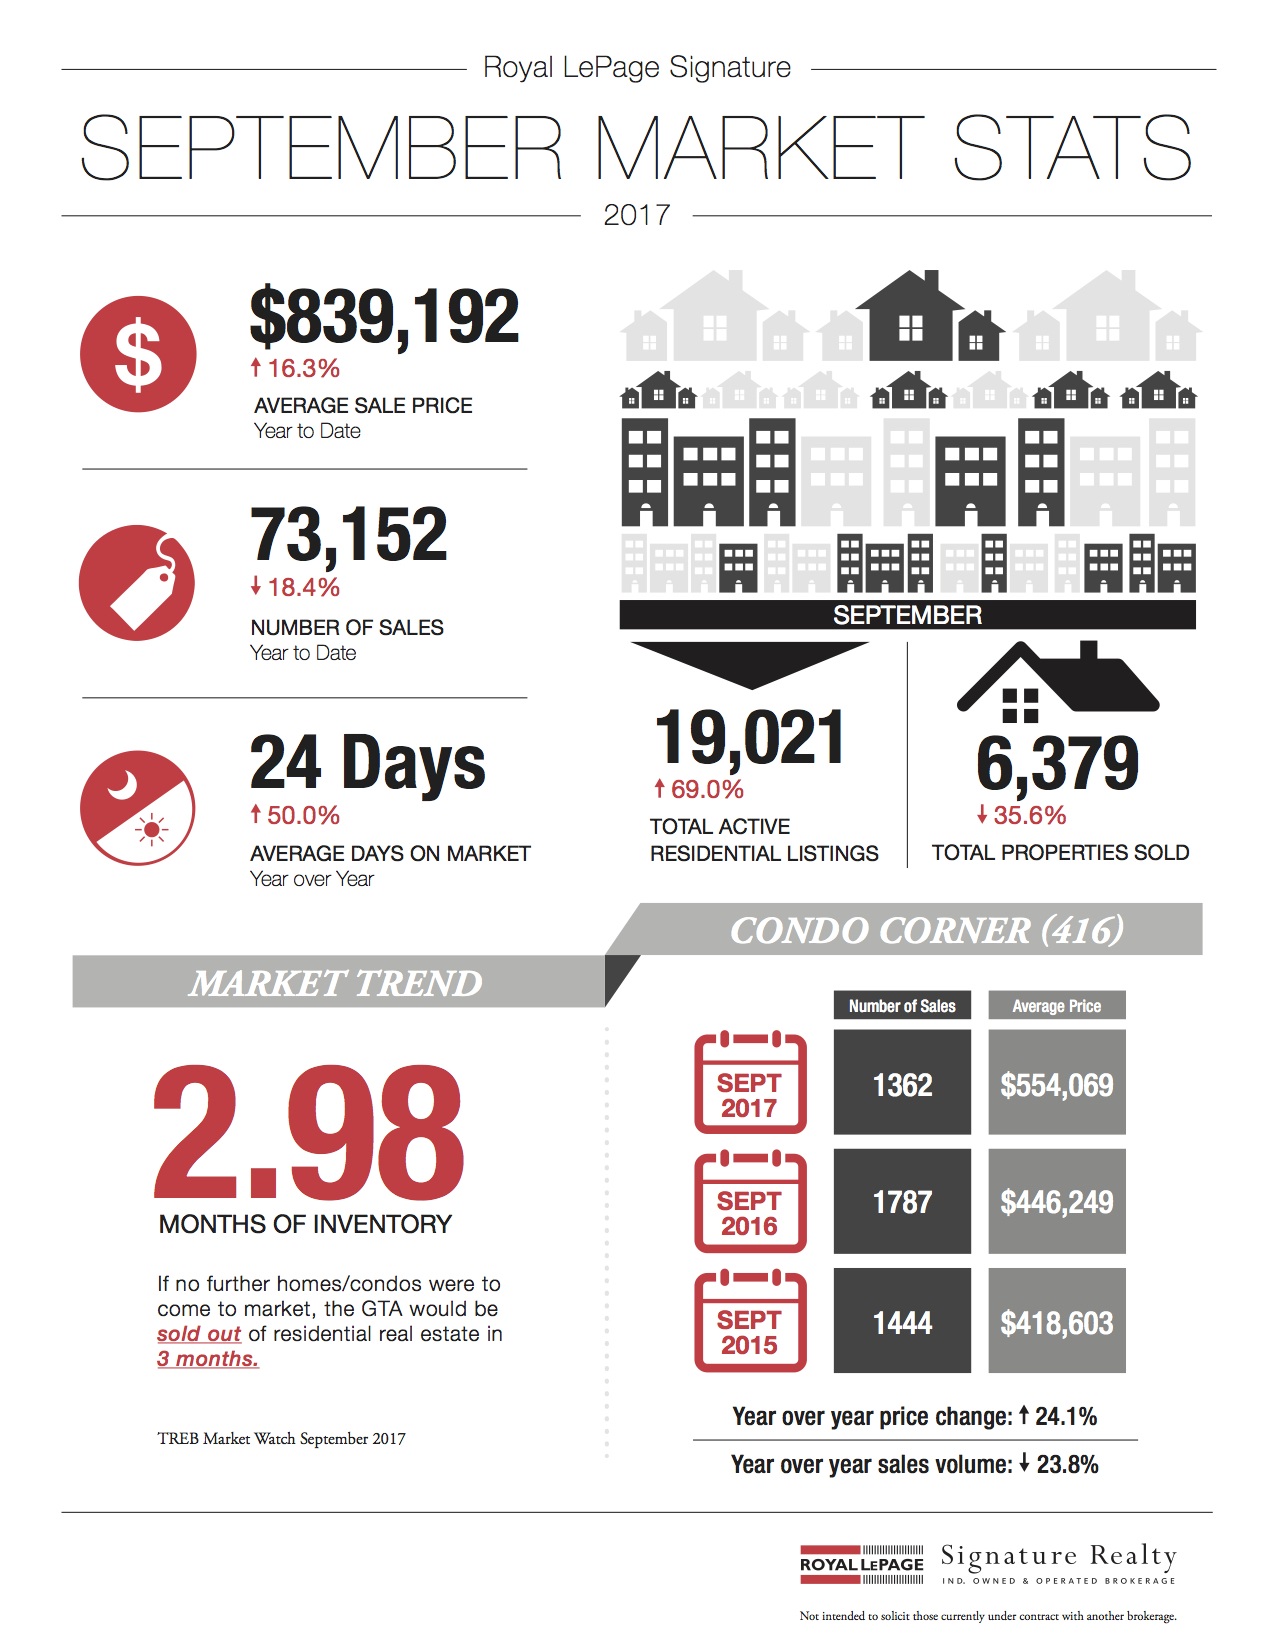
September 2017 Market Stats: Infographic & Report

September 2017 Market Stats: Infographic & Report Photo September 2017 market stats are here!

The average sale price for the month was $775,546, up 2.6% over September 2016.

Here's a breakdown of the average sale prices & year-over-year increases for the 416 area code:

  • Detached = $1,355,234 (+4.4%)
  • Semi-Detached = $935,467 (+5.2%)
  • Townhouse = $685,016 (+4.8%)
  • Condo Apartment = $554,069 (+24.0%)

And here's TREB’s official market report for the month September 2017:

Toronto Real Estate Board President Tim Syrianos announced that Greater Toronto Area REALTORS® reported 6,379 sales through TREB's MLS® System in September 2017. This result was down by 35 per cent compared to September 2016.

The number of new listings entered into TREB's MLS® System amounted to 16,469 in September – up by 9.4 per cent year-over-year.

"The improvement in listings in September compared to a year earlier suggests that home owners are anticipating an uptick in sales activity as we move through the fall. Consumer polling undertaken for TREB in the spring suggested that buying intentions over the next year remain strong. As we move through the fourth quarter we could see some buyers moving off the sidelines, taking advantage of a better-supplied marketplace," said Mr. Syrianos.

The average selling price in September 2017 was $775,546 – up 2.6 per cent compared to September 2016.

The MLS® Home Price Index (HPI) composite benchmark was up by 12.2 per cent on a year-over-year basis.

A key reason for the difference in annual growth rates between the average price and the MLS® HPI composite is the fact that detached homes – the most expensive market segment on average – accounted for a smaller share of overall transactions this year compared to last.

"With more balanced market conditions, the pace of year-over-year price growth was more moderate in September compared to a year ago. However, the exception was the condominium apartment market segment, where average and benchmark sales prices were up by more than 20 per cent compared to last year. Tighter market conditions for condominium apartments follows consumer polling results from the spring that pointed toward a shift to condos in terms of buyer intentions," said Jason Mercer, TREB's Director of Market Analysis.


If you’re thinking of making a move and would like to know how I can help, feel free to contact me for more info.

For complete copies of TREB’s Monthly Market Watch Reports, visit my archives here.

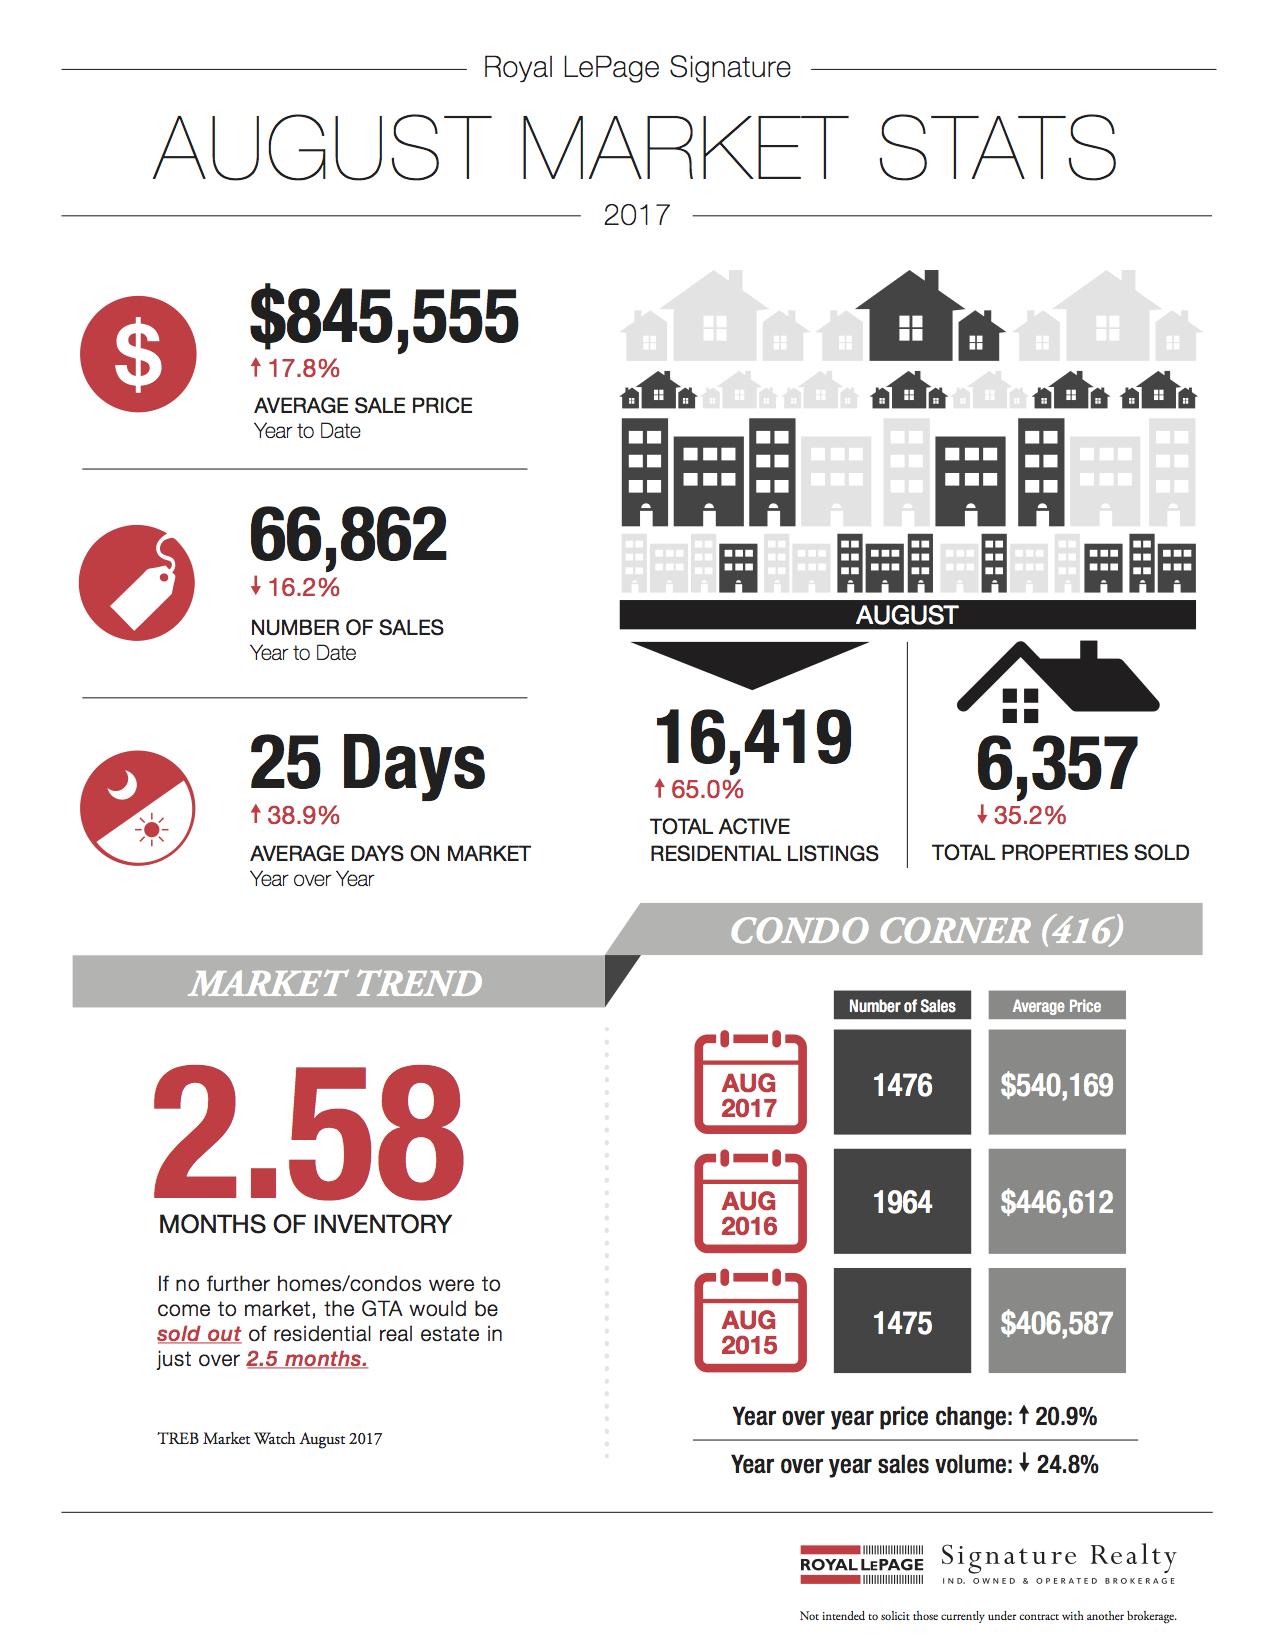
August 2017 Market Stats: Infographic & Report

August 2017 Market Stats: Infographic & Report Photo Following is TREB’s market report for August 2017:

Toronto Real Estate Board President Tim Syrianos announced that Greater Toronto Area REALTORS® reported 6,357 home sales through TREB's MLS® System in August 2017. This result was down by 34.8 per cent compared to August 2016.

The number of new listings entered into TREB's MLS® System, at 11,523, was down by 6.7 per cent year-over-year and was at the lowest level for August since 2010.

"Recent reports suggest that economic conditions remain strong in the GTA. Positive economic news coupled with the slower pace of price growth we are now experiencing could prompt an improvement in the demand for ownership housing, over and above the regular seasonal bump, as we move through the fall," continued Mr. Syrianos.

The average selling price for all home types combined was $732,292 – up by three per cent compared to August 2016. This growth was driven by the semi-detached, townhouse and condominium apartment market segments that continued to experience high single-digit or double digit year-over-year average price increases.

The MLS® Home Price Index composite benchmark, which accounts for typical home types throughout TREB's market area, was up by 14.3 per cent year-over-year in August. The fact that MLS® HPI growth outstripped average price growth, points to fewer high-end home sales this year compared to last.

"The relationship between sales and listings in the marketplace today suggests a balanced market. If current conditions are sustained over the coming months, we would expect to see year-over-year price growth normalize slightly above the rate of inflation. However, if some buyers move from the sidelines back into the marketplace, as TREB consumer research suggests may happen, an acceleration in price growth could result if listings remain at current levels," said Jason Mercer, TREB's Director of Market Analysis.


If you’re thinking of making a move and would like to know how I can help, feel free to contact me for more info.

For complete copies of TREB’s Monthly Market Watch Reports, visit my archives here.

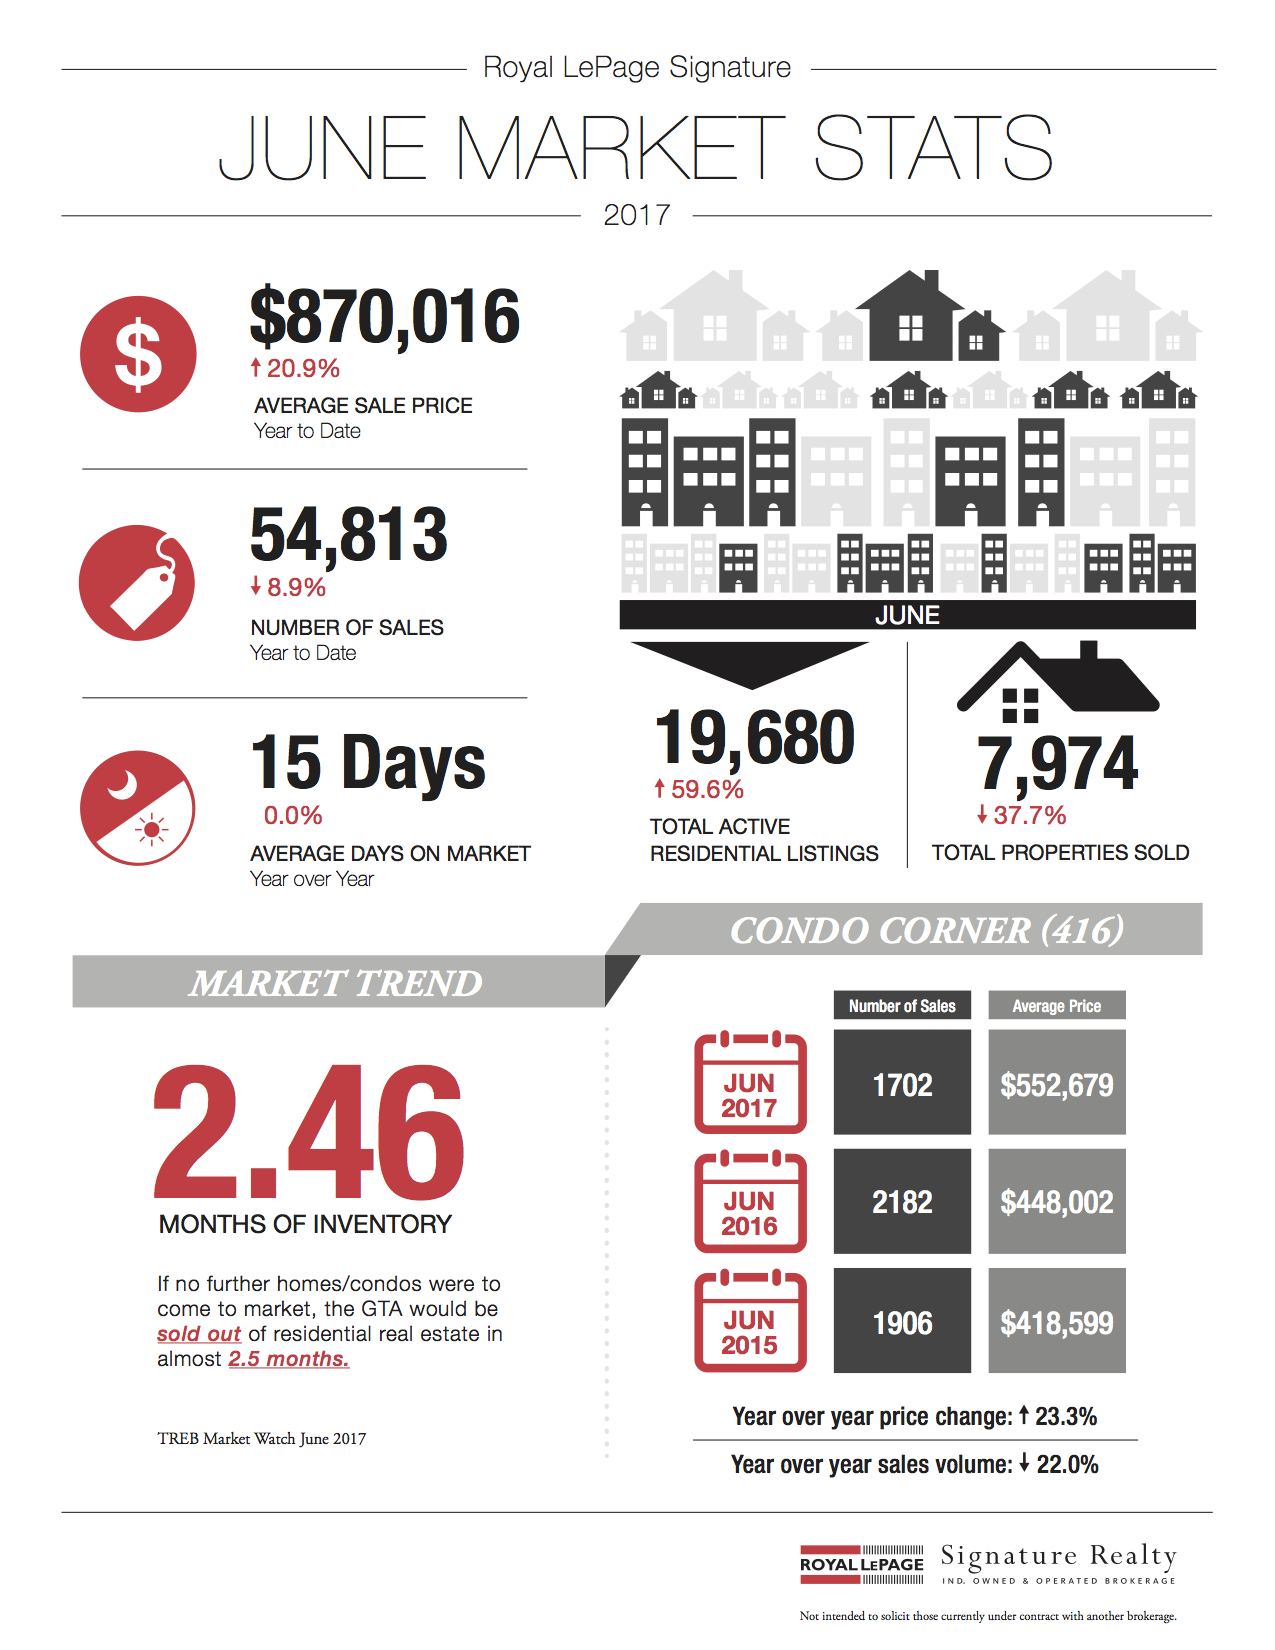
June 2017 Market Stats: Infographic & Report

June 2017 Market Stats: Infographic & Report Photo Following is TREB’s market report for June 2017:

Greater Toronto Area REALTORS® reported 7,974 sales through TREB's MLS® System in June 2017 – down by 37.3 per cent in comparison to June 2016.

The number of new residential listings entered into TREB's MLS® System, at 19,614, was up by 15.9 per cent compared to June 2016.

While this annual rate of growth was sizeable, it represented a more moderate annual rate of growth compared to May 2017, when new listings were up by 48.9 per cent year-over-year.

"We are in a period of flux that often follows major government policy announcements pointed at the housing market. On one hand, consumer survey results tell us many households are very interested in purchasing a home in the near future, but some of these would-be buyers seem to be temporarily on the sidelines waiting to see the real impact of the Ontario Fair Housing Plan. On the other hand, we have existing home owners who are listing their home because they feel price growth may have peaked. The end result has been a better supplied market and a moderating annual pace of price growth," said Mr. Syrianos.

Annual growth rates for MLS® HPI benchmark prices have moderated over the past two months, but remain strong.

The MLS® HPI composite benchmark price was up by 25.3 per cent on a year-over-year basis in June.

June's average selling price for all home types combined for the TREB market area was $793,915, representing a 6.3 per cent increase compared to the same month in 2016.

A better supplied market has certainly been a key factor influencing the moderation in price growth.

"Recent Ipsos survey results suggest that home buying activity in the GTA will remain strong moving forward. The year-over-year dip in home sales we have experienced over the last two months seem to be the result of would-be buyers putting their decision to purchase temporarily on hold while they monitor the impact of the Fair Housing Plan. On the supply side of the market, it certainly looks as though buyers will benefit from more choice in the second half of 2017 compared to the same period in 2016,"said Jason Mercer, TREB's Director of Market Analysis and Service Channels.


If you’re thinking of making a move and would like to know how I can help, feel free to contact me for more info.

For complete copies of TREB’s Monthly Market Watch Reports, visit my archives here.

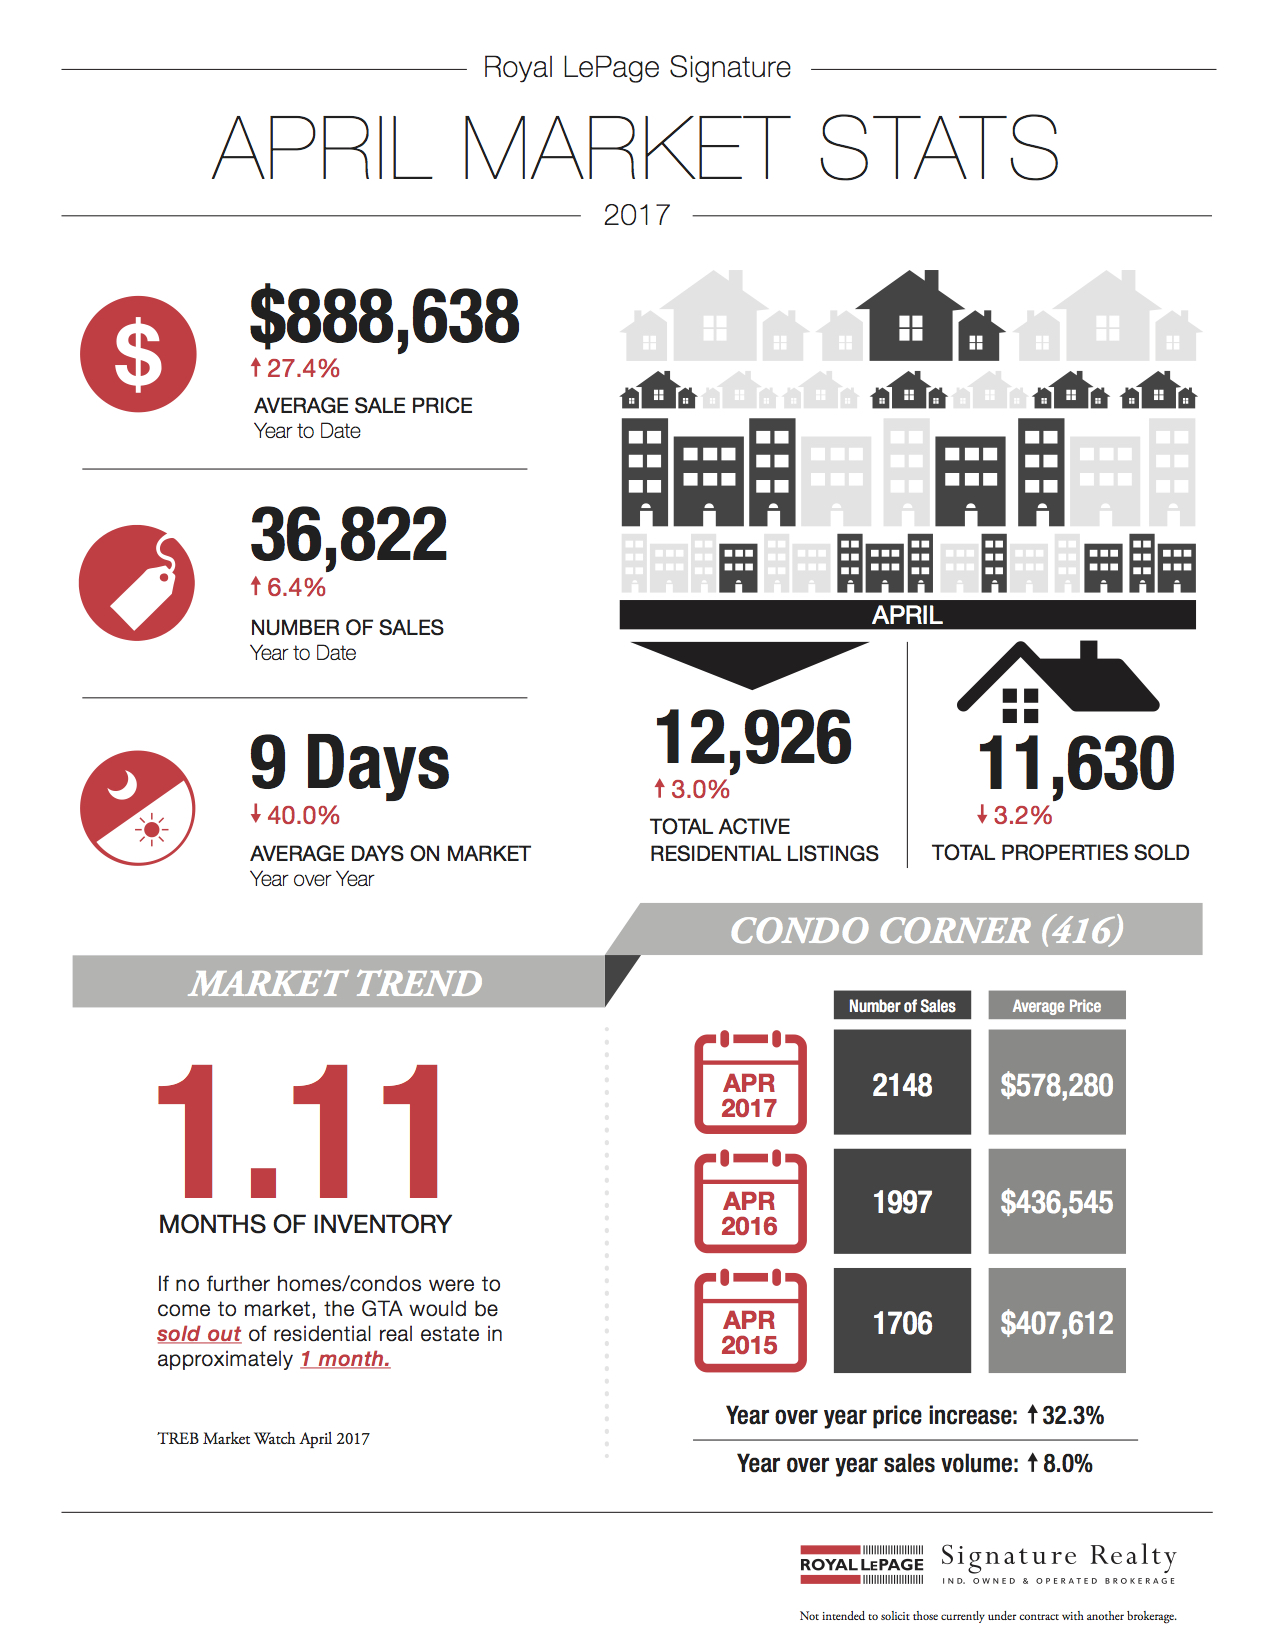
April 2017 Market Stats: Infographic & Report

April 2017 Market Stats: Infographic & Report Photo Following is TREB’s market report for April 2017:

Toronto Real Estate Board President Larry Cerqua announced that Greater Toronto Area REALTORS® entered 33.6 per cent more new listings into TREB's MLS® System in April 2017, at 21,630, compared to the same month in 2016.

New listings were up by double-digits for all low-rise home types, including detached and semi-detached houses and townhouses.

New listings for condominium apartments were at the same level as last year.

Total sales for the TREB market area as a whole amounted to 11,630 – down 3.2 per cent year-over-year.

One issue underlying this decline was the fact that Easter fell in April in 2017 versus March in 2016, which resulted in fewer working days this year compared to last and, historically, most sales are entered into TREB's MLS® System on working days.

"The fact that we experienced extremely strong growth in new listings in April means that buyers benefitted from considerably more choice in the marketplace. It is too early to tell whether the increase in new listings was simply due to households reacting to the strong double-digit price growth reported over the past year or if some of the increase was also a reaction to the Ontario government's recently announced Fair Housing Plan," said Mr. Cerqua.

The MLS® Home Price Index (HPI) Composite Benchmark Price was up by 31.7 per cent yearover- year in April 2017. Similarly, the average selling price for all home types combined was up by 24.5 per cent to $920,791.

"It was encouraging to see a very strong year-over-year increase in new listings. If new listings growth continues to outpace sales growth moving forward, we will start to see more balanced market conditions. It will likely take a number of months to unwind the substantial pent-up demand that has built over the past two years. Expect annual rates of price growth to remain well-above the rate of inflation as we move through the spring and summer months," said Jason Mercer, TREB's Director of Market Analysis.


If you’re thinking of making a move and would like to know how I can help, feel free to contact me for more info.

For complete copies of TREB’s Monthly Market Watch Reports, visit my archives here.

Point-By-Point: Ontario's Fair Housing Plan

Ontario's Fair Housing Plan: Point-By-Point Photo

.

Today, Premier Kathleen Wynne finally announced changes to real estate in Ontario in an attempt to increase supply and address affordability.

No doubt, there's going to be some confusion about the effects of the changes. Keep in mind though, the fundamentals of a healthy market have not changed.

Take a look at the plan below, point-by-point. If you've got any questions just give me a shout.

There are 16 proposed measures:

  1. A 15-per-cent non-resident speculation tax to be imposed on buyers in the Greater Golden Horseshoe area who are not citizens, permanent residents or Canadian corporations.

  2. Expanded rent control that will apply to all private rental units in Ontario, including those built after 1991, which are currently excluded.

  3. Updates to the Residential Tenancies Act to include a standard lease agreement, tighter provisions for “landlord’s own use” evictions, and technical changes to the Landlord-Tenant Board meant to make the process fairer, as well as other changes.

  4. A program to leverage the value of surplus provincial land assets across the province to develop a mix of market-price housing and affordable housing.

  5. Legislation that would allow Toronto and possibly other municipalities to introduce a vacant homes property tax in an effort to encourage property owners to sell unoccupied units or rent them out.

  6. A plan to ensure property tax for new apartment buildings is charged at a similar rate as other residential properties.

  7. A five-year, $125-million program aimed at encouraging the construction of new rental apartment buildings by rebating a portion of development charges.

  8. More flexibility for municipalities when it comes to using property tax tools to encourage development.

  9. The creation of a new Housing Supply Team with dedicated provincial employees to identify barriers to specific housing development projects and work with developers and municipalities to find solutions.

  10. An effort to understand and tackle practices that may be contributing to tax avoidance and excessive speculation in the housing market.

  11. A review of the rules real estate agents are required to follow to ensure that consumers are fairly represented in real estate transactions.

  12. The launch of a housing advisory group which will meet quarterly to provide the government with ongoing advice about the state of the housing market and discuss the impact of the measures and any additional steps that are needed.

  13. Education for consumers on their rights, particularly on the issue of one real estate professional representing more than one party in a real estate transaction.

  14. A partnership with the Canada Revenue Agency to explore more comprehensive reporting requirements so that correct federal and provincial taxes, including income and sales taxes, are paid on purchases and sales of real estate in Ontario.

  15. Set timelines for elevator repairs to be established in consultation with the sector and the Technical Standards & Safety Authority.

  16. Provisions that would require municipalities to consider the appropriate range of unit sizes in higher density residential buildings to accommodate a diverse range of household sizes and incomes, among other things.


If you’re thinking of making a move and would like to know how I can help, feel free to contact me for more info.


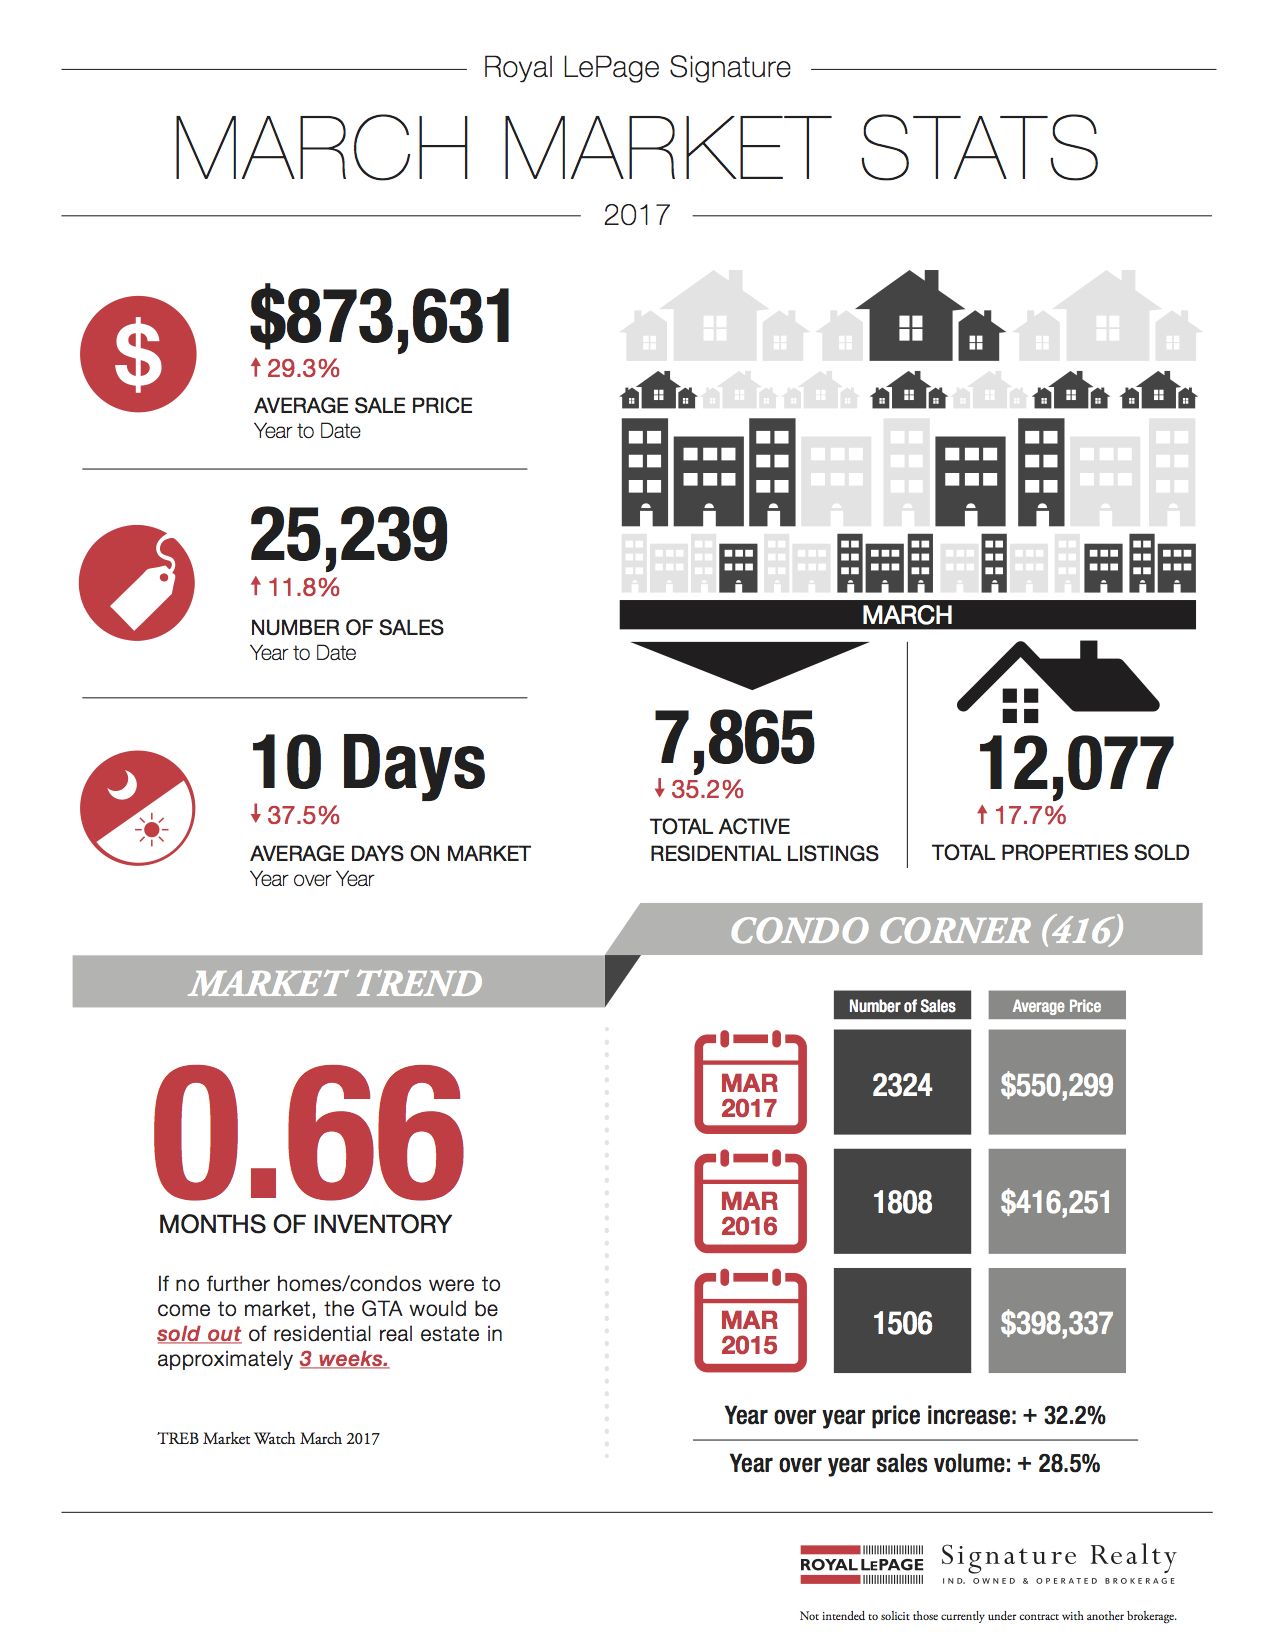
March 2017 Market Stats: Infographic & Report

March 2017 Market Stats: Infographic & Report Photo Following is TREB’s market report for March 2017:

Toronto Real Estate Board President Larry Cerqua announced that Greater Toronto Area REALTORS® reported 12,077 residential sales through TREB’s MLS® System in March 2017.

This result represented a 17.7 per cent increase compared to the 10,260 sales reported in March 2016.

For the TREB market area as a whole, annual sales growth was strongest for condominium apartments and detached houses.

The number of new listings also increased on a year-over-year basis, at 17,051 – a 15.2 per cent increase compared to March 2016.

The strongest growth in new listings was experienced in the detached market segment.

While new listings were up strongly compared to last year, the rate new listings growth was still lower than the rate of sales growth.

As a result, GTA market conditions continued to tighten.

“It has been encouraging to see that policymakers have not implemented any knee-jerk policies regarding the GTA housing market. Different levels of government are holding consultations with market stakeholders and TREB has participated and will continue to participate in these discussions. Policy makers must remember that it is the interplay between the demand for and supply of listings that influences price growth,” said Mr. Cerqua.

Strong competition between buyers continued to cause high levels of price growth in all major market segments.

The MLS® Home Price Index (HPI) Composite Benchmark Price was up by 28.6 per cent year-over-year.

For the TREB market area as a whole, the average selling price was up by 33.2 per cent, with similar annual rates of growth in the low-rise and condominium apartment segments.

“Annual rates of price growth continued to accelerate in March as growth in sales outstripped growth in listings. A substantial period of months in which listings growth is greater than sales growth will be required to bring the GTA housing market back into balance. As policy makers seek to achieve this balance, it is important that an evidence-based approach is followed,” said Jason Mercer, TREB’s Director of Market Analysis.


If you’re thinking of making a move and would like to know how I can help, feel free to contact me for more info.

For complete copies of TREB’s Monthly Market Watch Reports, visit my archives here.

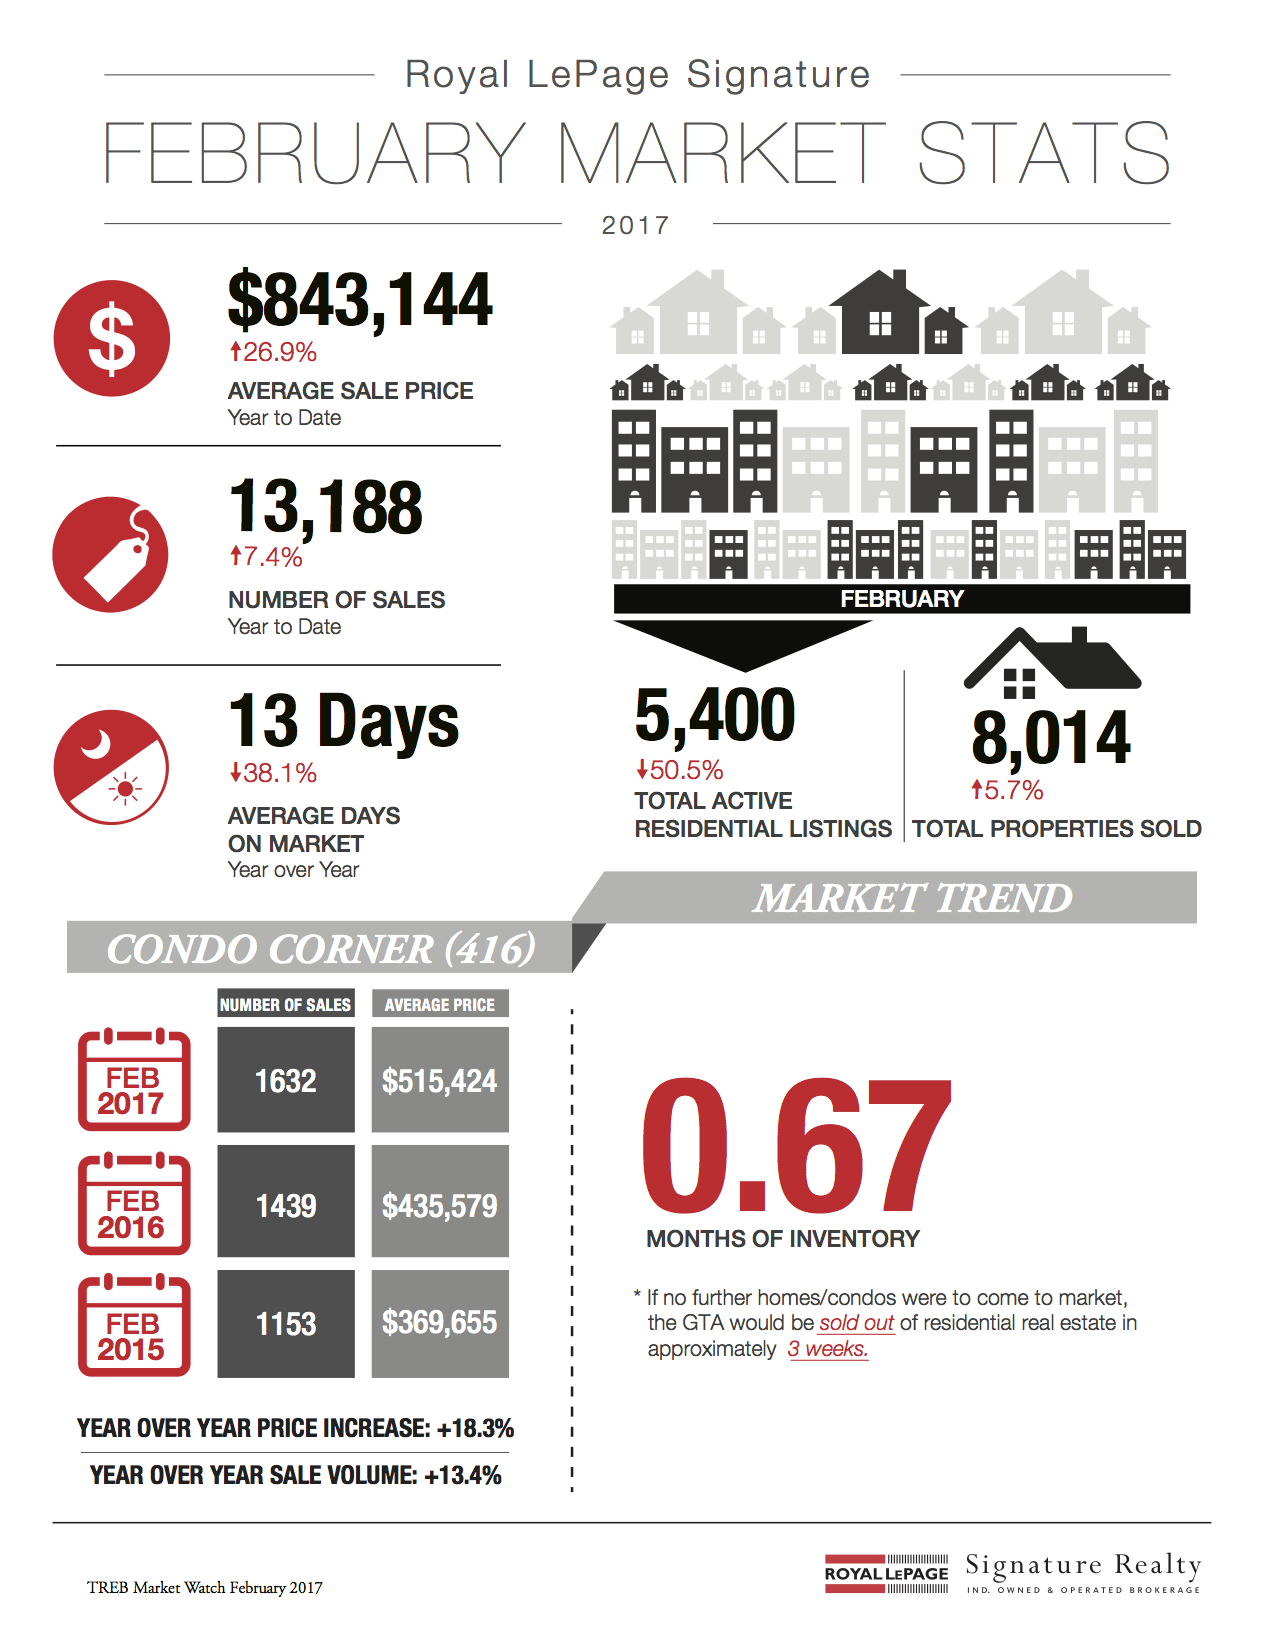
February 2017 Market Stats: Infographic & Report

February 2017 Market Stats: Infographic & Report Photo Following is TREB’s market report for February 2017:

Toronto Real Estate Board President Larry Cerqua announced that Greater Toronto Area REALTORS® reported 8,014 residential sales through TREB’s MLS® System in February 2017.

Despite the fact that February 2016 had one more day due to the leap year day, this result was up on a year-over-year basis by 5.7 per cent compared to 7,583 sales reported last year.

“The February statistics tell me that many Greater Toronto Area households continue to view home ownership as a great long-term investment. The high demand for ownership housing we’re seeing is broad-based, with strong sales growth for most low-rise home types and condominium apartments. This makes sense given the results of a recent consumer survey undertaken for TREB by Ipsos, which found an even split between intending first-time buyers and existing homeowners who indicated that they were planning on purchasing a home in 2017,” said Cerqua.

While the demand for ownership housing grew over the past year, new listings entered into TREB's MLS® System in February were down on a year-over-year basis by 12.5 per cent to 9,834.

The MLS® HPI Composite Benchmark Price was up by 23.8 per cent compared to February 2016.

Similarly, the average selling price was up by 27.7 per cent year-over-year to $875,983.

Annual rates of price growth continued to be strongest for low-rise home types, particularly detached houses.

Growth rates for condominium apartment prices were also in the double digits, likely a result of strong demand from first-time buyers.

"The listing supply crunch we are experiencing in the GTA has undoubtedly led to the double- digit home price increases we are now experiencing on a sustained basis, both in the low-rise and high-rise market segments. Until we see a marked increase in the number of homes available for sale, expect very strong annual rates of price growth to continue," said Jason Mercer, TREB's Director of Market Analysis.


If you’re thinking of making a move and would like to know how I can help, feel free to contact me for more info.

For complete copies of TREB’s Monthly Market Watch Reports, visit my archives here.


Toronto Land Transfer Taxes Are Increasing. Ugh.

Toronto Land Transfer Tax Costs Are Going Up On March 1st Photo

Toronto Land Transfer Tax Costs Are Going Up On March 1st Photo

If you haven't already heard, the City of Toronto Council has approved changes to the Toronto Land Transfer Tax which will result in additional costs for some home buyers with a closing date on or after March 1, 2017 (which is when the tax will be harmonized with the provincial LTT).

Click here to see the detailed City of Toronto Notice on the "original" proposed changes posted in December 2016 (NOTE: changes made to original proposals as per below).

Status

The following changes to the Toronto Land Transfer Tax were considered and approved by Toronto City Council on February 15, 2017. The changes are effective AS OF MARCH 1, 2017, for real estate transactions closing on or after this date:

  • Added an additional LTT of 0.5% of the value of a residential or non-residential property from $250,000 to $400,000 (an additional $750)

  • Added an additional LTT of 0.5% of the value of a residential property above $2 million

  • Added an additional LTT of 0.5% of the value above $400,000 of a non-residential property

  • Increasing the maximum allowed First-Time Home Buyer Rebate to $4,475, up from $3,725

  • Amended the first-time home buyer rebate program eligibility rules to restrict rebate eligibility to Canadian citizens or permanent residents of Canada

TREB Efforts Achieved Significant Concessions – First-Time Buyers Protected

TREB (Toronto Real Estate Board) undertook a comprehensive campaign to oppose the proposed changes. As a result of these efforts, significant concessions were made to the proposals that went forward for City Council's consideration as follows:

  • Under the original proposal, first-time buyers would have been forced to pay an additional $475 in Toronto LTT. However, TREB pushed for an increase in the rebate from $3,725 to $4,475, meaning first-time buyers will not face an increase.

  • Many first-time buyers would have lost eligibility for the first-time buyer rebate entirely, meaning a total LTT increase of $4,475. TREB pushed back and all first-time buyers will be eligible for a rebate.

  • As a result of TREB's efforts, first-time home buyers will NOT see any change.

If you’re thinking of making a move and would like to know how I can help, feel free to contact me for more info.

It Sold For HOW Much? WTF!

I’ve been a realtor for over 10 years now, and I can honestly say that I’ve never seen as many WTF sale prices as I saw last week.

It’s not unusual for a house to sell for stupid money in this city (it is Toronto after all), but last week was notable because it happened so many times!

All over the city, almost every day, houses and condos were selling for unprecedented figures.

“Unprecedented” is the key word here, but I’m not sure it really does justice to what we saw last week.

A few examples…

Sale #1: A condo townhouse in the east-end

  • 1,100 sq ft
  • 2-bed / 2-bath
  • Parking

The last few comparable sales happened back in the summer, and sold for around $580,000. This new listing was priced at $589,000 and sold on offer-night… for $840,000!

Sale #2: A freehold home in the Don Mills area

  • 1,500 sq ft
  • 3-bed / 3-bath
  • Detached 2-storey

The listing agent and seller priced it low ($1,188,000), thinking that it might sell for somewhere in the $1,500,000 - $1,600,000 range. It sold on offer-night (with 31 offers) for… $2,303,000! Read more about this sale in the Toronto Star here.

Sale #3: A one-bedroom condo in the downtown core

  • 600 sq ft
  • 1-bed / 1-bath
  • No parking

A nearly identical unit sold in this building in the spring, for around $390,000. This new listing was priced at $435,000 and sold on offer-night… for $505,000!

It’s Sunday night as I write this, and I’m wondering what tomorrow and the rest of the week will bring. It can’t be as crazy as last week, can it? We’ll see…


If you’re thinking of making a move and would like to know how I can help, feel free to contact me for more info.

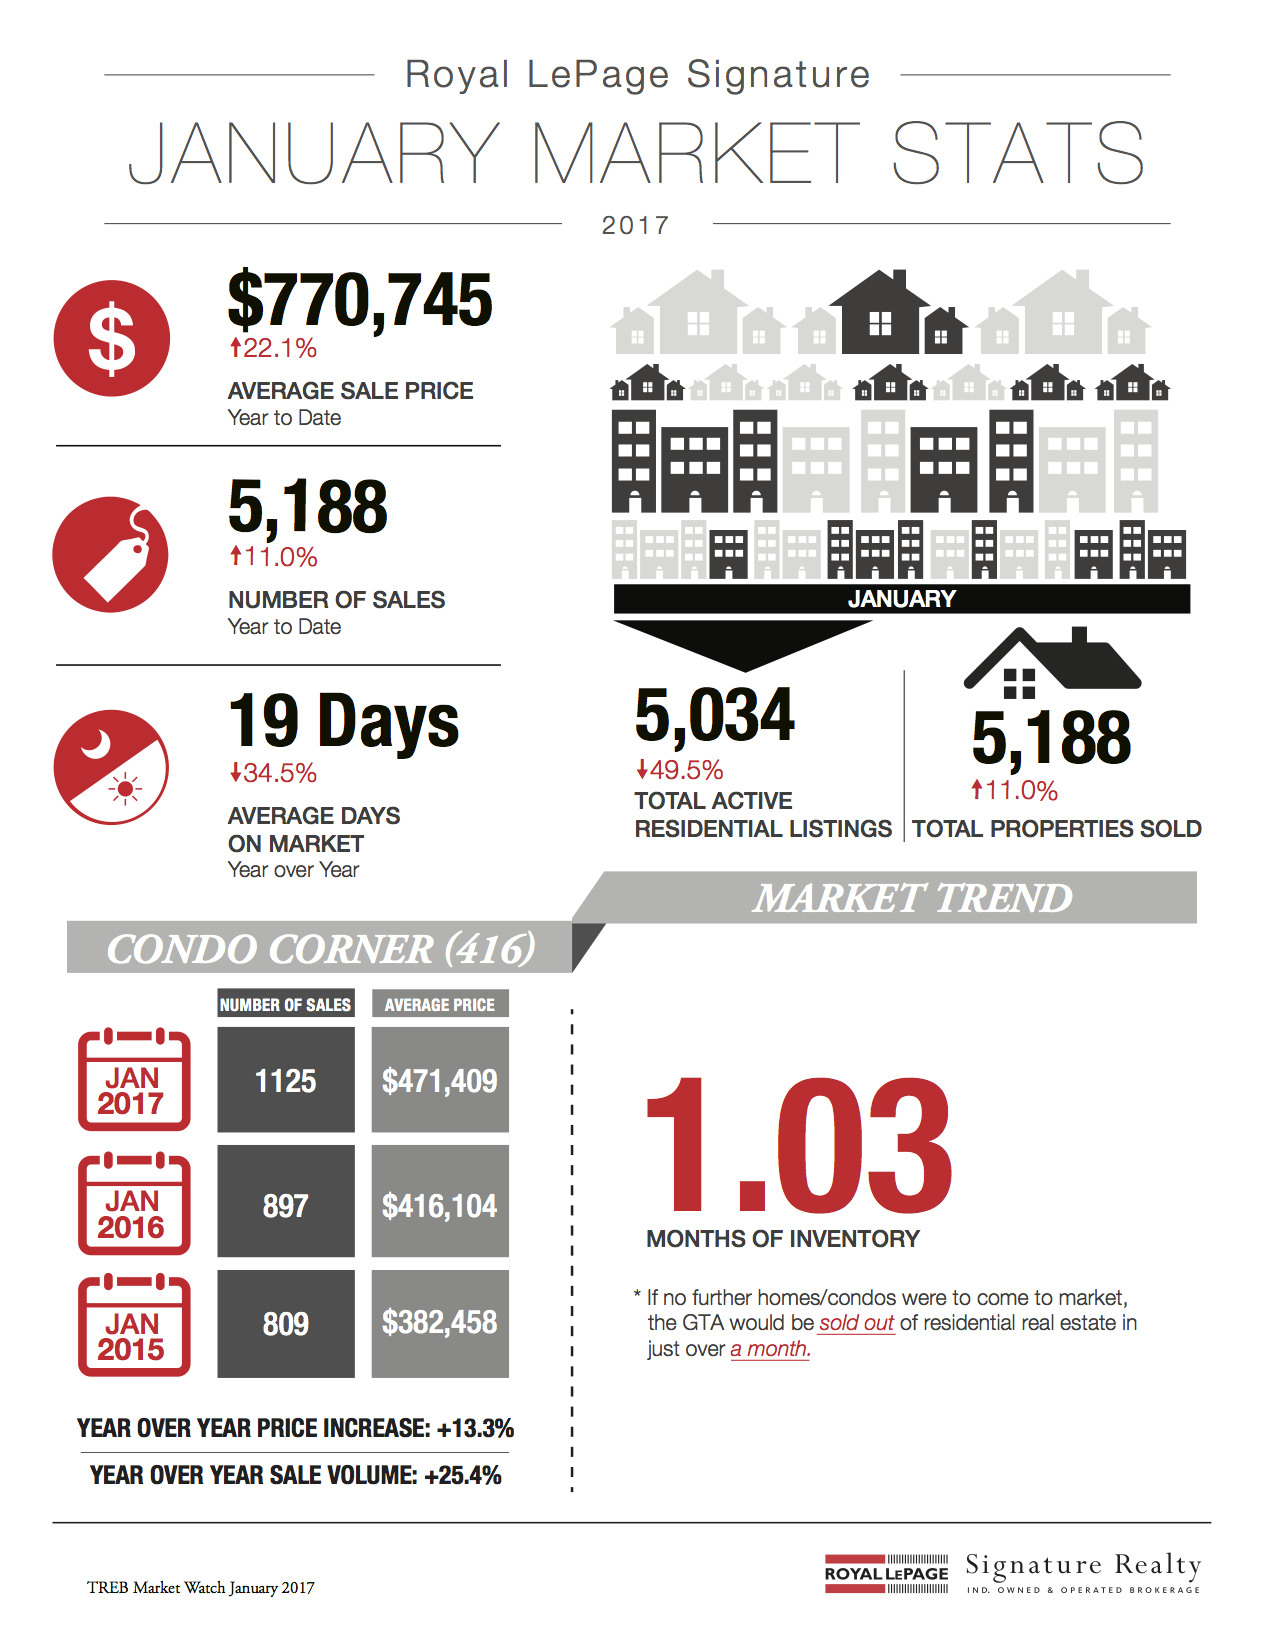
January 2017 Market Stats: Infographic & Report

January 2017 Market Stats: Infographic & Report Photo Following is TREB’s market report for January 2017:

Toronto Real Estate Board President Larry Cerqua announced that Greater Toronto Area REALTORS® reported 5,188 residential transactions through TREB's MLS® System in January 2017.

This result was up by 11.8 per cent compared to 4,640 sales reported in January 2016.

Annual rates of sales growth were higher for condominium apartments than for low-rise home types.

January 2017 picked up where 2016 left off: sales were up on a year-over-year basis while the number of new listings was down by double-digit annual rates for most major home types.

"Home ownership continues to be a great investment and remains very important to the majority of GTA households. As we move through 2017, we expect the demand for ownership housing to remain strong, including demand from first-time buyers who, according to a recent Ipsos survey, could account for more than half of transactions this year. However, many of these would-be buyers will have problems finding a home that meets their needs in a market with very little inventory," said Cerqua.

The MLS® Home Price Index (HPI) Composite Benchmark price was up by 21.8 per cent on a year-over-year basis in January.

Similarly, over the same period, the average selling price was up by 22.3 per cent to $770,745, with double-digit gains in the average prices for all major home types.

"The number of active listings on TREB's MLS® System at the end of January was essentially half of what was reported as available at the same time last year. That statistic, on its own, tells us that there is a serious supply problem in the GTA – a problem that will continue to play itself out in 2017. The result will be very strong price growth for all home types again this year," said Jason Mercer, TREB's Director of Market Analysis.


If you’re thinking of making a move and would like to know how I can help, feel free to contact me for more info.

For complete copies of TREB’s Monthly Market Watch Reports, visit my archives here.

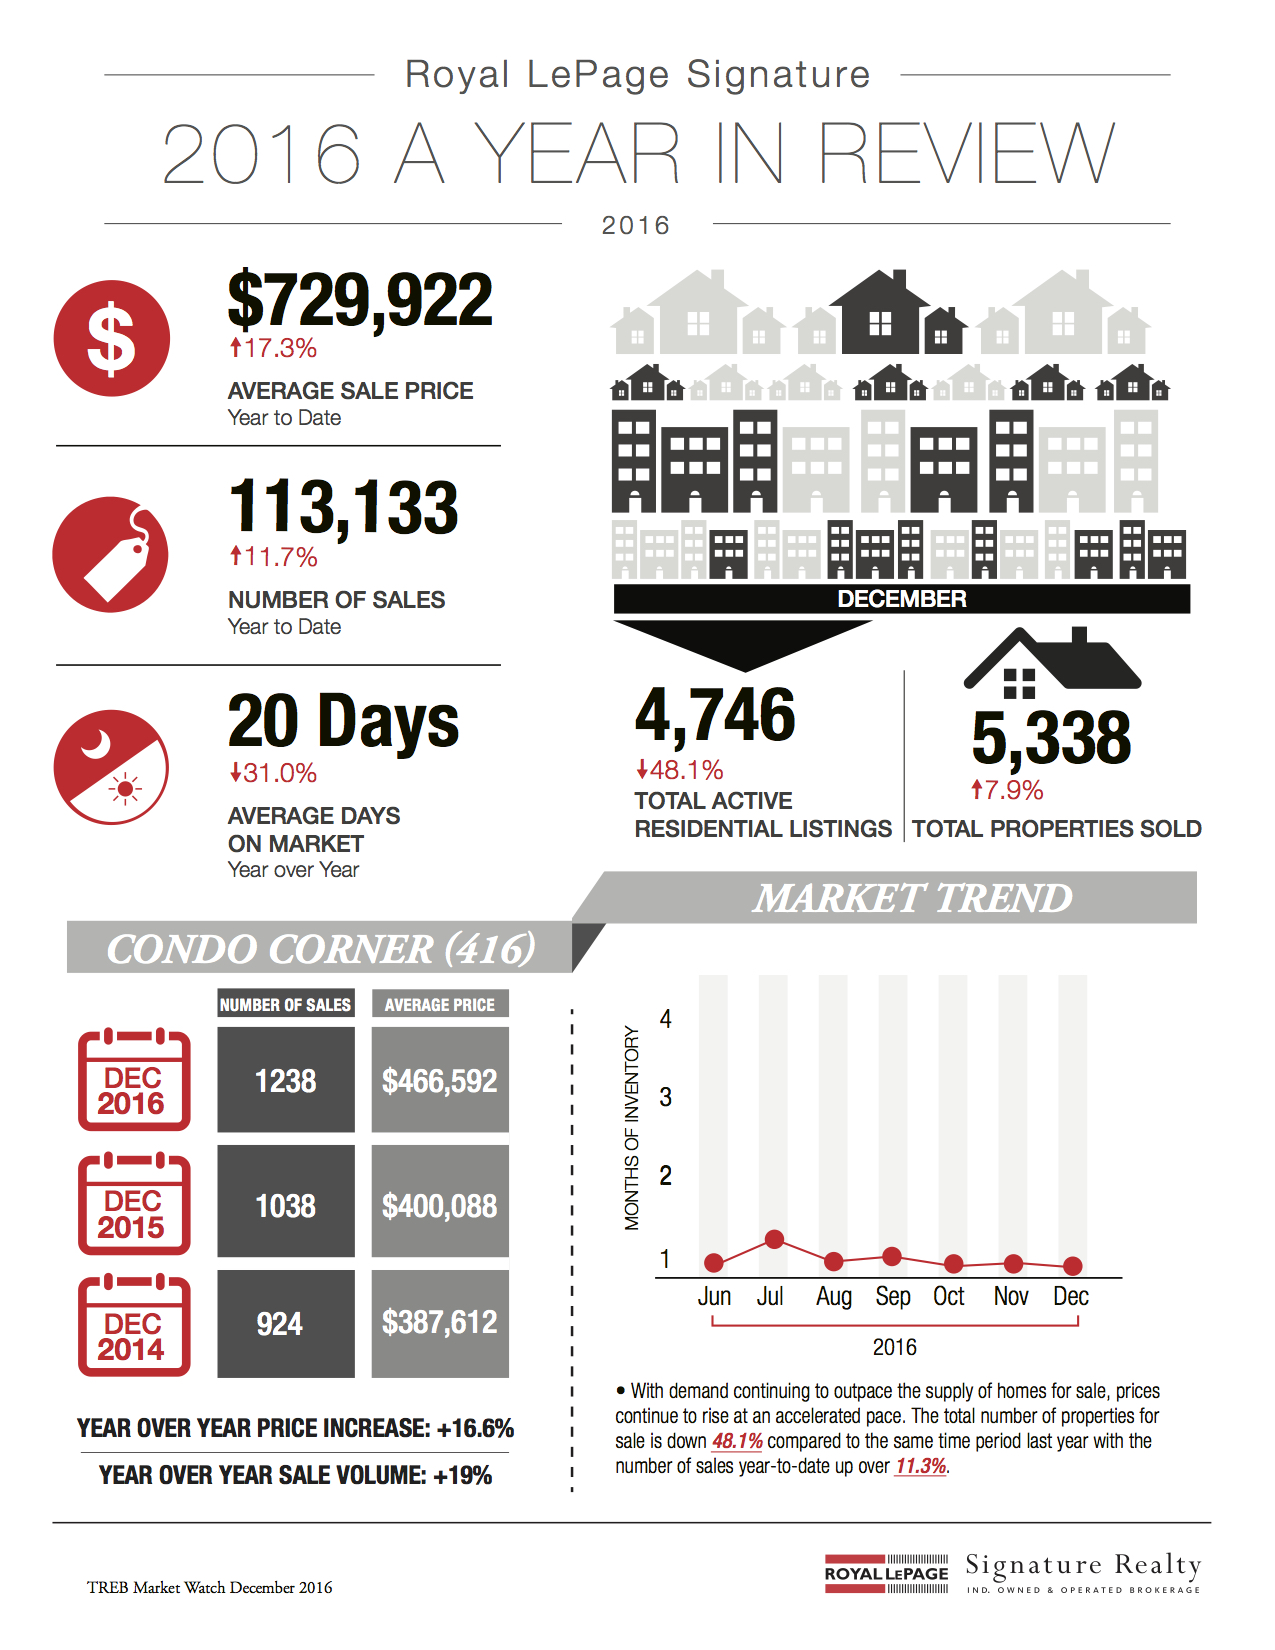
2016 Year In Review: Infographic & Report

January 2017 Market Stats: Infographic & Report Photo Following is TREB’s market report for the year 2016:

Toronto Real Estate Board President Larry Cerqua announced that 2016 was a second consecutive record year for home sales.

Greater Toronto Area REALTORS® reported 113,133 home sales through TREB’s MLS® System – up by 11.8 per cent compared to 2015.

The calendar year 2016 result included 5,338 sales in December – an annual increase of 8.6 per cent.

The strongest annual rate of sales growth in 2016 was experienced for condominium apartments followed by detached homes.

“A relatively strong regional economy, low unemployment and very low borrowing costs kept the demand for ownership housing strong in the GTA, as the region’s population continued to grow in 2016,” said Mr. Cerqua.

The annual rate of growth for the MLS® Home Price Index (HPI) in the TREB market area accelerated throughout 2016 – from 10.7 per cent in January 2016 to 21 per cent in December 2016.

The overall average selling price for calendar year 2016 was $729,922 – up 17.3 per cent compared to 2015.

The pace of the annual rate of growth for the average selling price also picked up throughout the year, including a climb of 20 per cent in December.

“Price growth accelerated throughout 2016 as the supply of listings remained very constrained. Active listings at the end of December were at their lowest point in a decade-and-a-half. Total new listings for 2016 were down by almost four per cent. In 2016, we saw policy changes and policy debates pointed at the demand side of the market. If we want to see a sustained moderation in the pace of price growth, what we really need is more policy focus on issues impacting the lack of homes available for sale,” said Jason Mercer, TREB’s Director of Market Analysis.


If you’re thinking of making a move and would like to know how I can help, feel free to contact me for more info.

For complete copies of TREB’s Monthly Market Watch Reports, visit my archives here.

October 2016 Market Stats: Infographic & Report

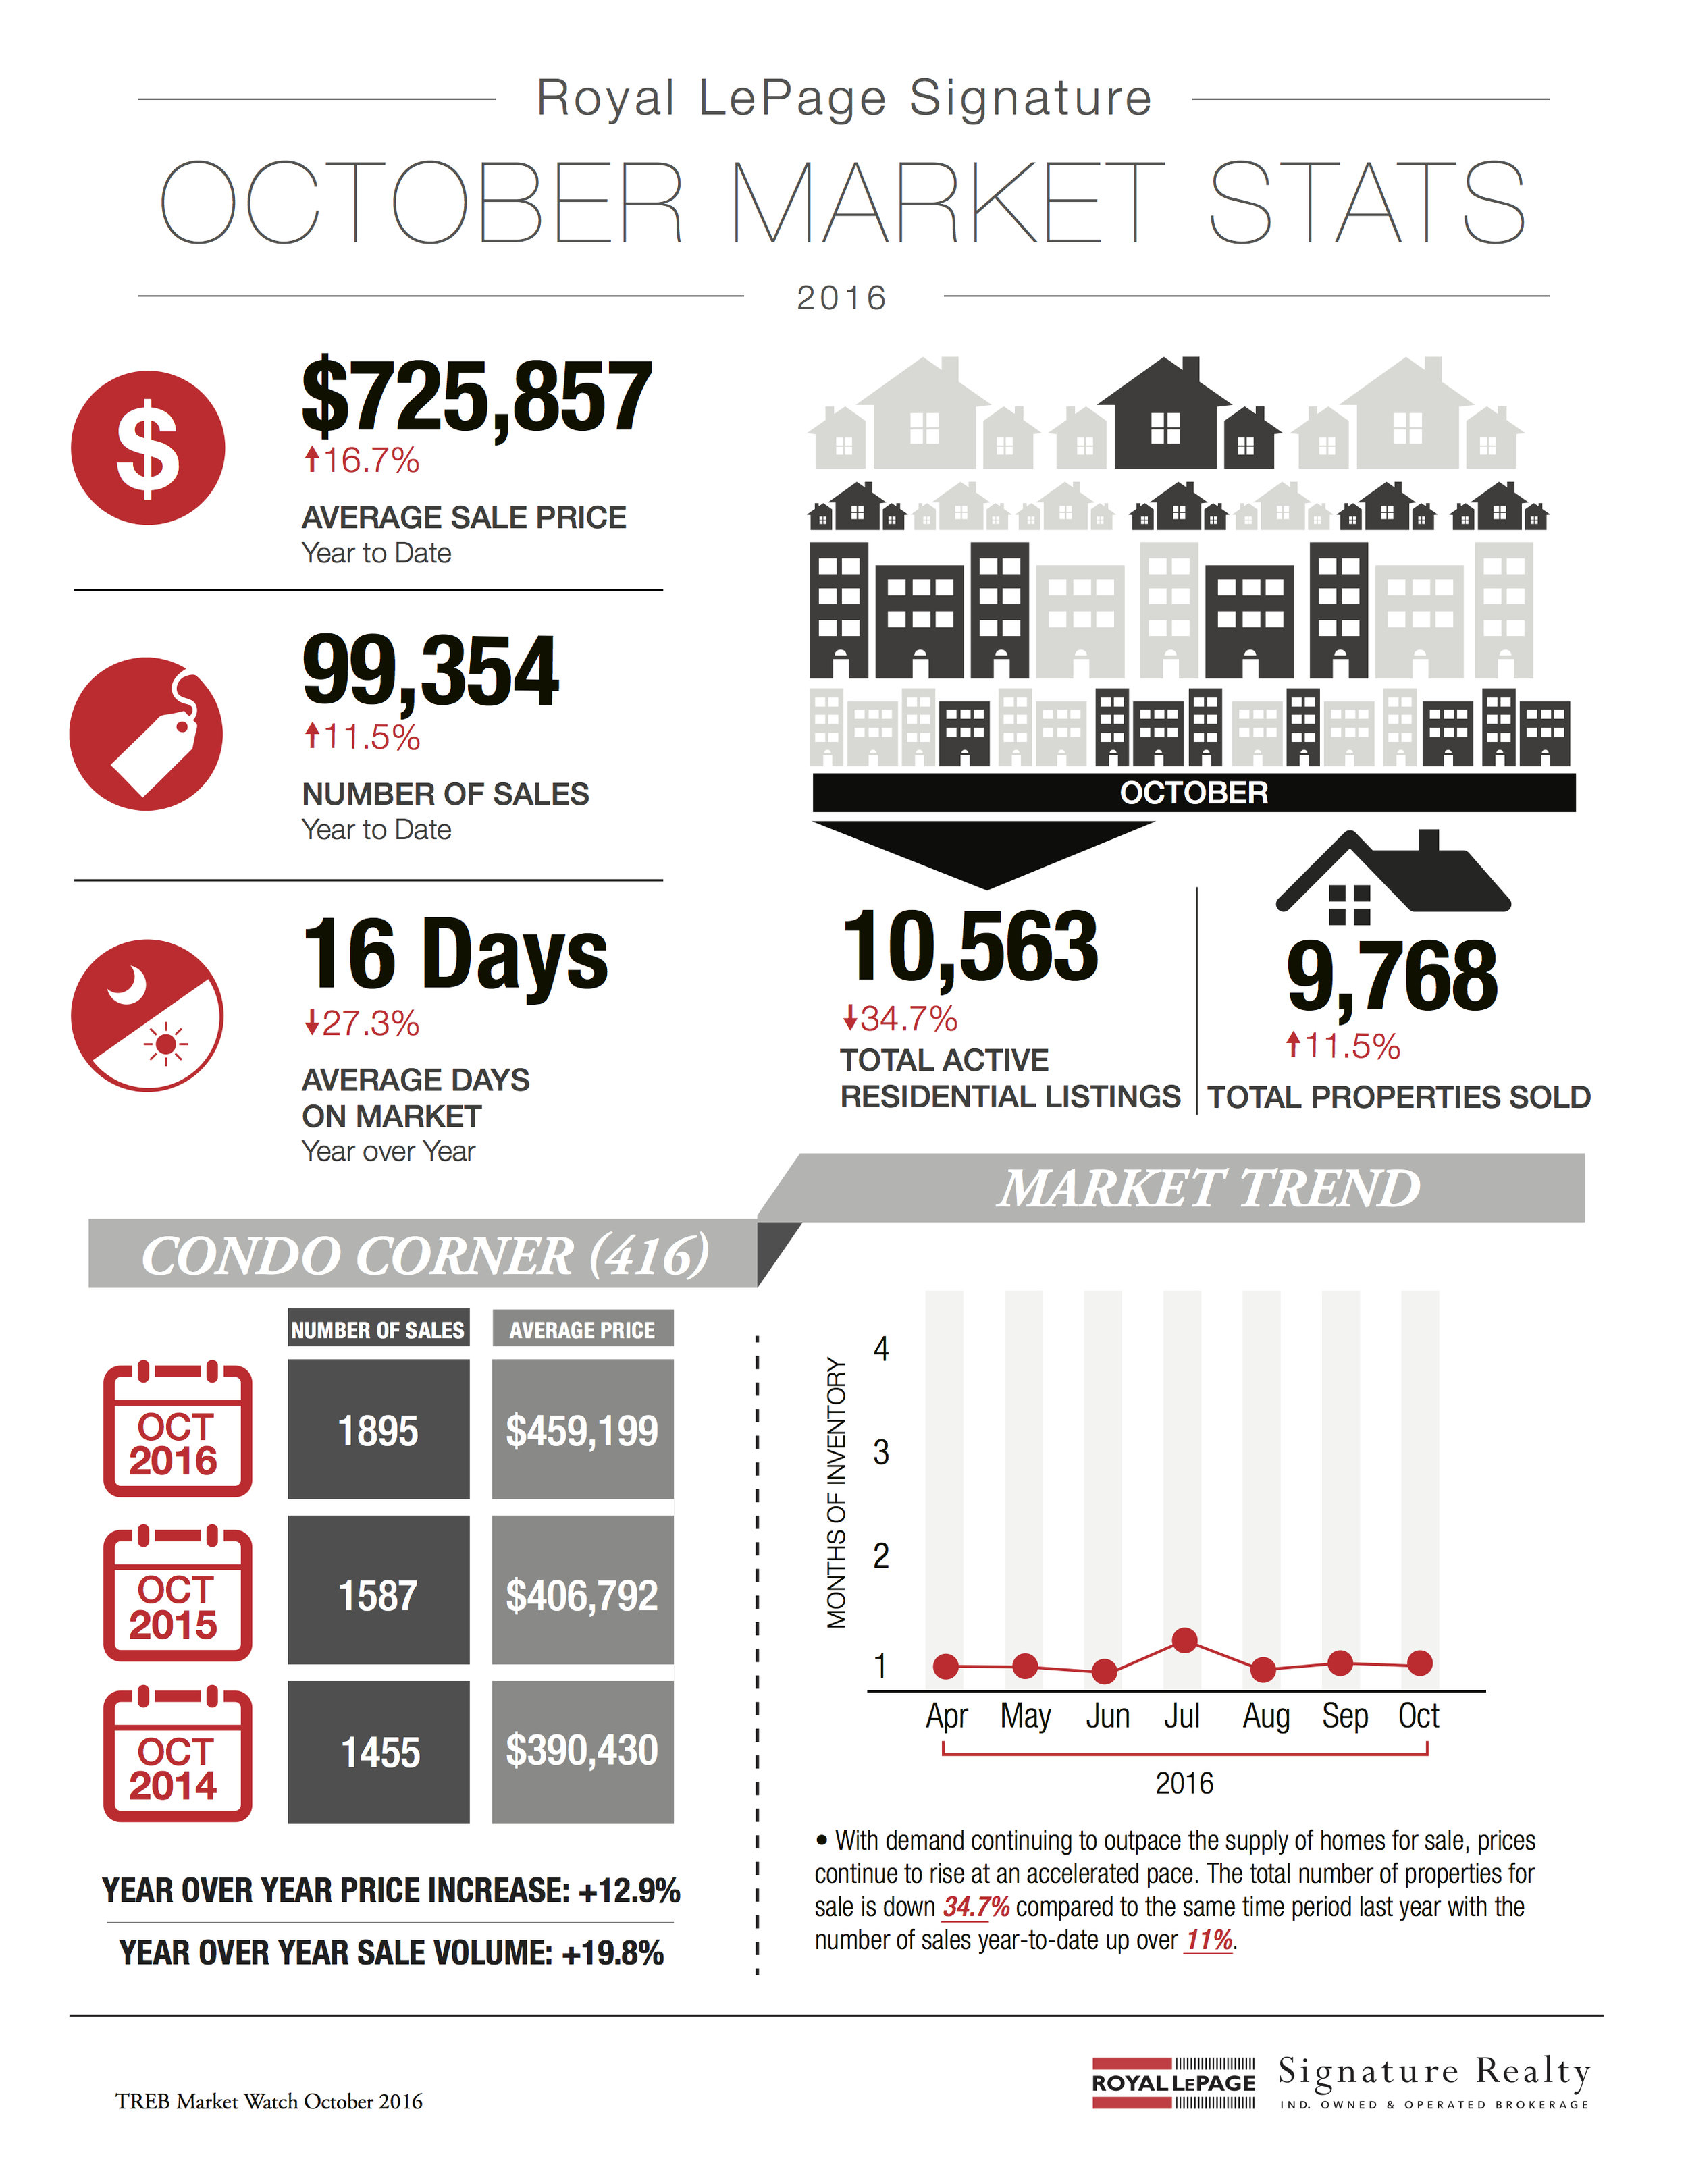
October 2016 Market Stats: Infographic & Report - Photo Following is TREB’s market report for October 2016:

Toronto Real Estate Board President Larry Cerqua announced that Greater Toronto Area REALTORS® reported a record 9,768 sales through TREB’s MLS® System in October 2016 – up by 11.5 per cent compared to October 2015.

For the TREB market area as a whole, the largest annual rate of sales growth was in the condominium apartment market segment.

Detached home sales were up by 10 per cent year-over-year, driven predominantly by transactions in the regions surrounding Toronto.

“The record pace of GTA home sales continued in October, with strong growth observed throughout the month. As we move through November and December, we will be watching the sales and listings trends closely, in light of the recent policy changes announced by the Federal Minister of Finance. TREB will once again be conducting consumer survey work, in order to report on home buying intentions for 2017,” said Mr. Cerqua.

The MLS® Home Price Index Composite Benchmark was up by 19.7 per cent on a year-over-year basis in October 2016.

Similarly, the average selling price for all home types combined was $762,975 – up 21.1 per cent over the same time period. Double-digit increases were experienced for all major home types for the TREB Market Area as a whole.

“New listings were up slightly in October compared to last year, but not nearly enough to offset the strong sales growth. This meant that seller’s market conditions continued to prevail as buyers of all home types experienced intense competition in the marketplace. Until we experience sustained relief in the supply of listings, the potential for strong annual rates of price growth will persist, especially in the low-rise market segments,” said Jason Mercer, TREB’s Director of Market Analysis.


If you’re thinking of making a move and would like to know how I can help, feel free to contact me for more info.

For complete copies of TREB’s Monthly Market Watch Reports, visit my archives here.

Four Major Changes To Canada's Housing Rules

Four Major Changes To Canada's Housing Rules - Photo If you haven't already heard, the Canadian Department of Finance made an announcement earlier this month outlining a handful of changes that will have an impact on the mortgage/housing market.

The Globe & Mail followed the announcement pretty quickly with a detailed breakdown of all the changes, and how the affects might be felt.

Below is a reposting of that article in full. Enjoy!


From the Globe & Mail, on October 3rd, 2016:

Four Major Changes To Canada's Housing Rules

The Liberal government has announced sweeping changes aimed at ensuring Canadians aren’t taking on bigger mortgages than they can afford in an era of historically low interest rates.

The changes are also meant to address concerns related to foreign buyers who buy and flip Canadian homes.

Below is a breakdown of the four major changes Finance Minister Bill Morneau announced Monday.

The current rules

Buyers with a down payment of at least 5 per cent of the purchase price but less than 20 per cent must be backed by mortgage insurance. This protects the lender in the event that the home buyer defaults. These loans are known as “high loan-to-value” or “high ratio” mortgages.

In situations in which the buyer has 20 per cent or more for a down payment, the lender or borrower could obtain “low-ratio” insurance that covers 100 per cent of the loan in the event of a default.

Mortgage insurance in Canada is backed by the federal government through the Canada Mortgage and Housing Corp. Insurance is sold by the CMHC and two private insurers, Genworth Financial Mortgage Insurance Company Canada and Canada Guaranty Mortgage Insurance Company. The federal government backs the insurance offered by the two private-sector firms, subject to a 10-per-cent deductible.

------

The change

Expanding a mortgage rate stress test to all insured mortgages.

What it is

As of Oct. 17, a stress test used for approving high-ratio mortgages will be applied to all new insured mortgages – including those where the buyer has more than 20 per cent for a down payment. The stress test is aimed at assuring the lender that the home buyer could still afford the mortgage if interest rates were to rise. The home buyer would need to qualify for a loan at the negotiated rate in the mortgage contract, but also at the Bank of Canada’s five-year fixed posted mortgage rate, which is an average of the posted rates of the big six banks in Canada. This rate is usually higher than what buyers can negotiate. As of Sept. 28, the posted rate was 4.64 per cent.

Other aspects of the stress test require that the home buyer will be spending no more than 39 per cent of income on home-carrying costs like mortgage payments, heat and taxes. Another measure called total debt service includes all other debt payments and the TDS ratio must not exceed 44 per cent.

Who it affects

This measure affects home buyers who have at least 20 per cent for a down payment but are seeking a mortgage that may stretch them too thin if interest rates were to rise. It also affects lenders seeking to buy government-backed insurance for low-ratio mortgages.

Why

The government is responding to concerns that sharp rises in house prices in cities like Toronto and Vancouver could increase the risk of defaults in the future should mortgage rates rise.

------

The change

As of Nov. 30, the government will impose new restrictions on when it will provide insurance for low-ratio mortgages.

What it is

The new rules restrict insurance for these types of mortgages based on new criteria, including that the amortization period must be 25 years or less, the purchase price is less than $1-million, the buyer has a credit score of 600 and the property will be owner-occupied.

Who it affects

This measure appears to be aimed at lowering the government’s exposure to residential mortgages for properties worth $1-million or more, a category of the market that has increased sharply in recent years in Vancouver and Toronto.

Why

Vancouver and Toronto are the two real estate markets that are of most concern for policy makers at all levels of government. These measures appear to be targeted at those markets.

------

The change

New reporting rules for the primary residence capital gains exemption.

What it is

Currently, any financial gain from selling your primary residence is tax-free and does not have to be reported as income. As of this tax year, the capital gains tax is still waived, but the sale of the primary residence must be reported at tax time to the Canada Revenue Agency.

Who it affects

Everyone who sells their primary residence will have a new obligation to report the sale to the CRA, however the change is aimed at preventing foreign buyers who buy and sell homes from claiming a primary residence tax exemption for which they are not entitled.

Why

While officials say more data are needed, Ottawa is responding to extensive anecdotal evidence and media reports showing foreign investors are flipping homes in Canada and falsely claiming the primary residence exemption.

------

The change

The government is launching consultations on lender risk sharing.

What it is

Currently, the federal government is on the hook to cover the cost of 100 per cent of an insured mortgage in the event of a default. The federal government says this is “unique” internationally and that it will be releasing a public consultation paper shortly on a proposal to have lenders, such as banks, take on some of that risk. The Department of Finance Canada acknowledges this would be “a significant structural change to Canada’s housing finance system.”

Who it affects

Mortgage lenders, such as banks, would have to take on added risk. This could potentially lead to higher mortgage rates for home buyers.

Why

The federal government wants to limit its financial obligations in the event of widespread mortgage defaults. It also wants to encourage prudent lending practices.

------

Five previous federal housing moves since 2008

Monday’s package of announcements is the sixth time since the onset of the 2008 financial crisis that Ottawa has taken policy action in response to concerns about Canada’s housing market. July, 2008: After briefly allowing the CMHC to insure high-ratio mortgages with a 40-year amortization period, then Conservative finance minister Jim Flaherty moved to tighten those rules by reducing the maximum length of an insured high-ratio mortgage to 35 years.

February, 2010: Responding to concern that some Canadians were borrowing too much against the rising value of their homes, the government lowered the maximum amount Canadians could borrow in refinancing their mortgages to 90 per cent of a home’s value, down from 95 per cent. The move also set a new 20-per-cent down payment requirement for government-backed mortgage insurance on properties purchased for speculation by an owner who does not live in the property.

January, 2011: The Conservative government under Stephen Harper tightened the rules further, dropping the maximum amortization period for a high-ratio insured mortgage to 30 years. The maximum amount Canadians could borrow via refinancing was further lowered to 85 per cent.

June, 2012: A third round of tightening brought the maximum amortization period down to 25 years for high-ratio insured mortgages. A new stress test was also introduced to ensure that debt costs are no more than 44 per cent of income for lenders seeking a high-ratio mortgage. Refinancing rules were also tightened for a third time, setting a new maximum loan of 80 per cent of a property’s value. Another new measure limited the availability of government-backed insured high-ratio mortgages to homes valued at less than $1-million.

December, 2015: The recently elected Liberal government moved to tighten lending rules for homes worth more than $500,000, saying it was focused on “pockets of risk” in the housing sector. The package of measures included doubling the minimum down payment for insured high-ratio mortgages to 10 per cent from 5 per cent for the portion of a home’s value from $500,000 to $1-million.

August 2016 Market Stats: Infographic & Report

August 2016 Market Stats: Infographic & Report Photo Following is TREB’s market report for August 2016:
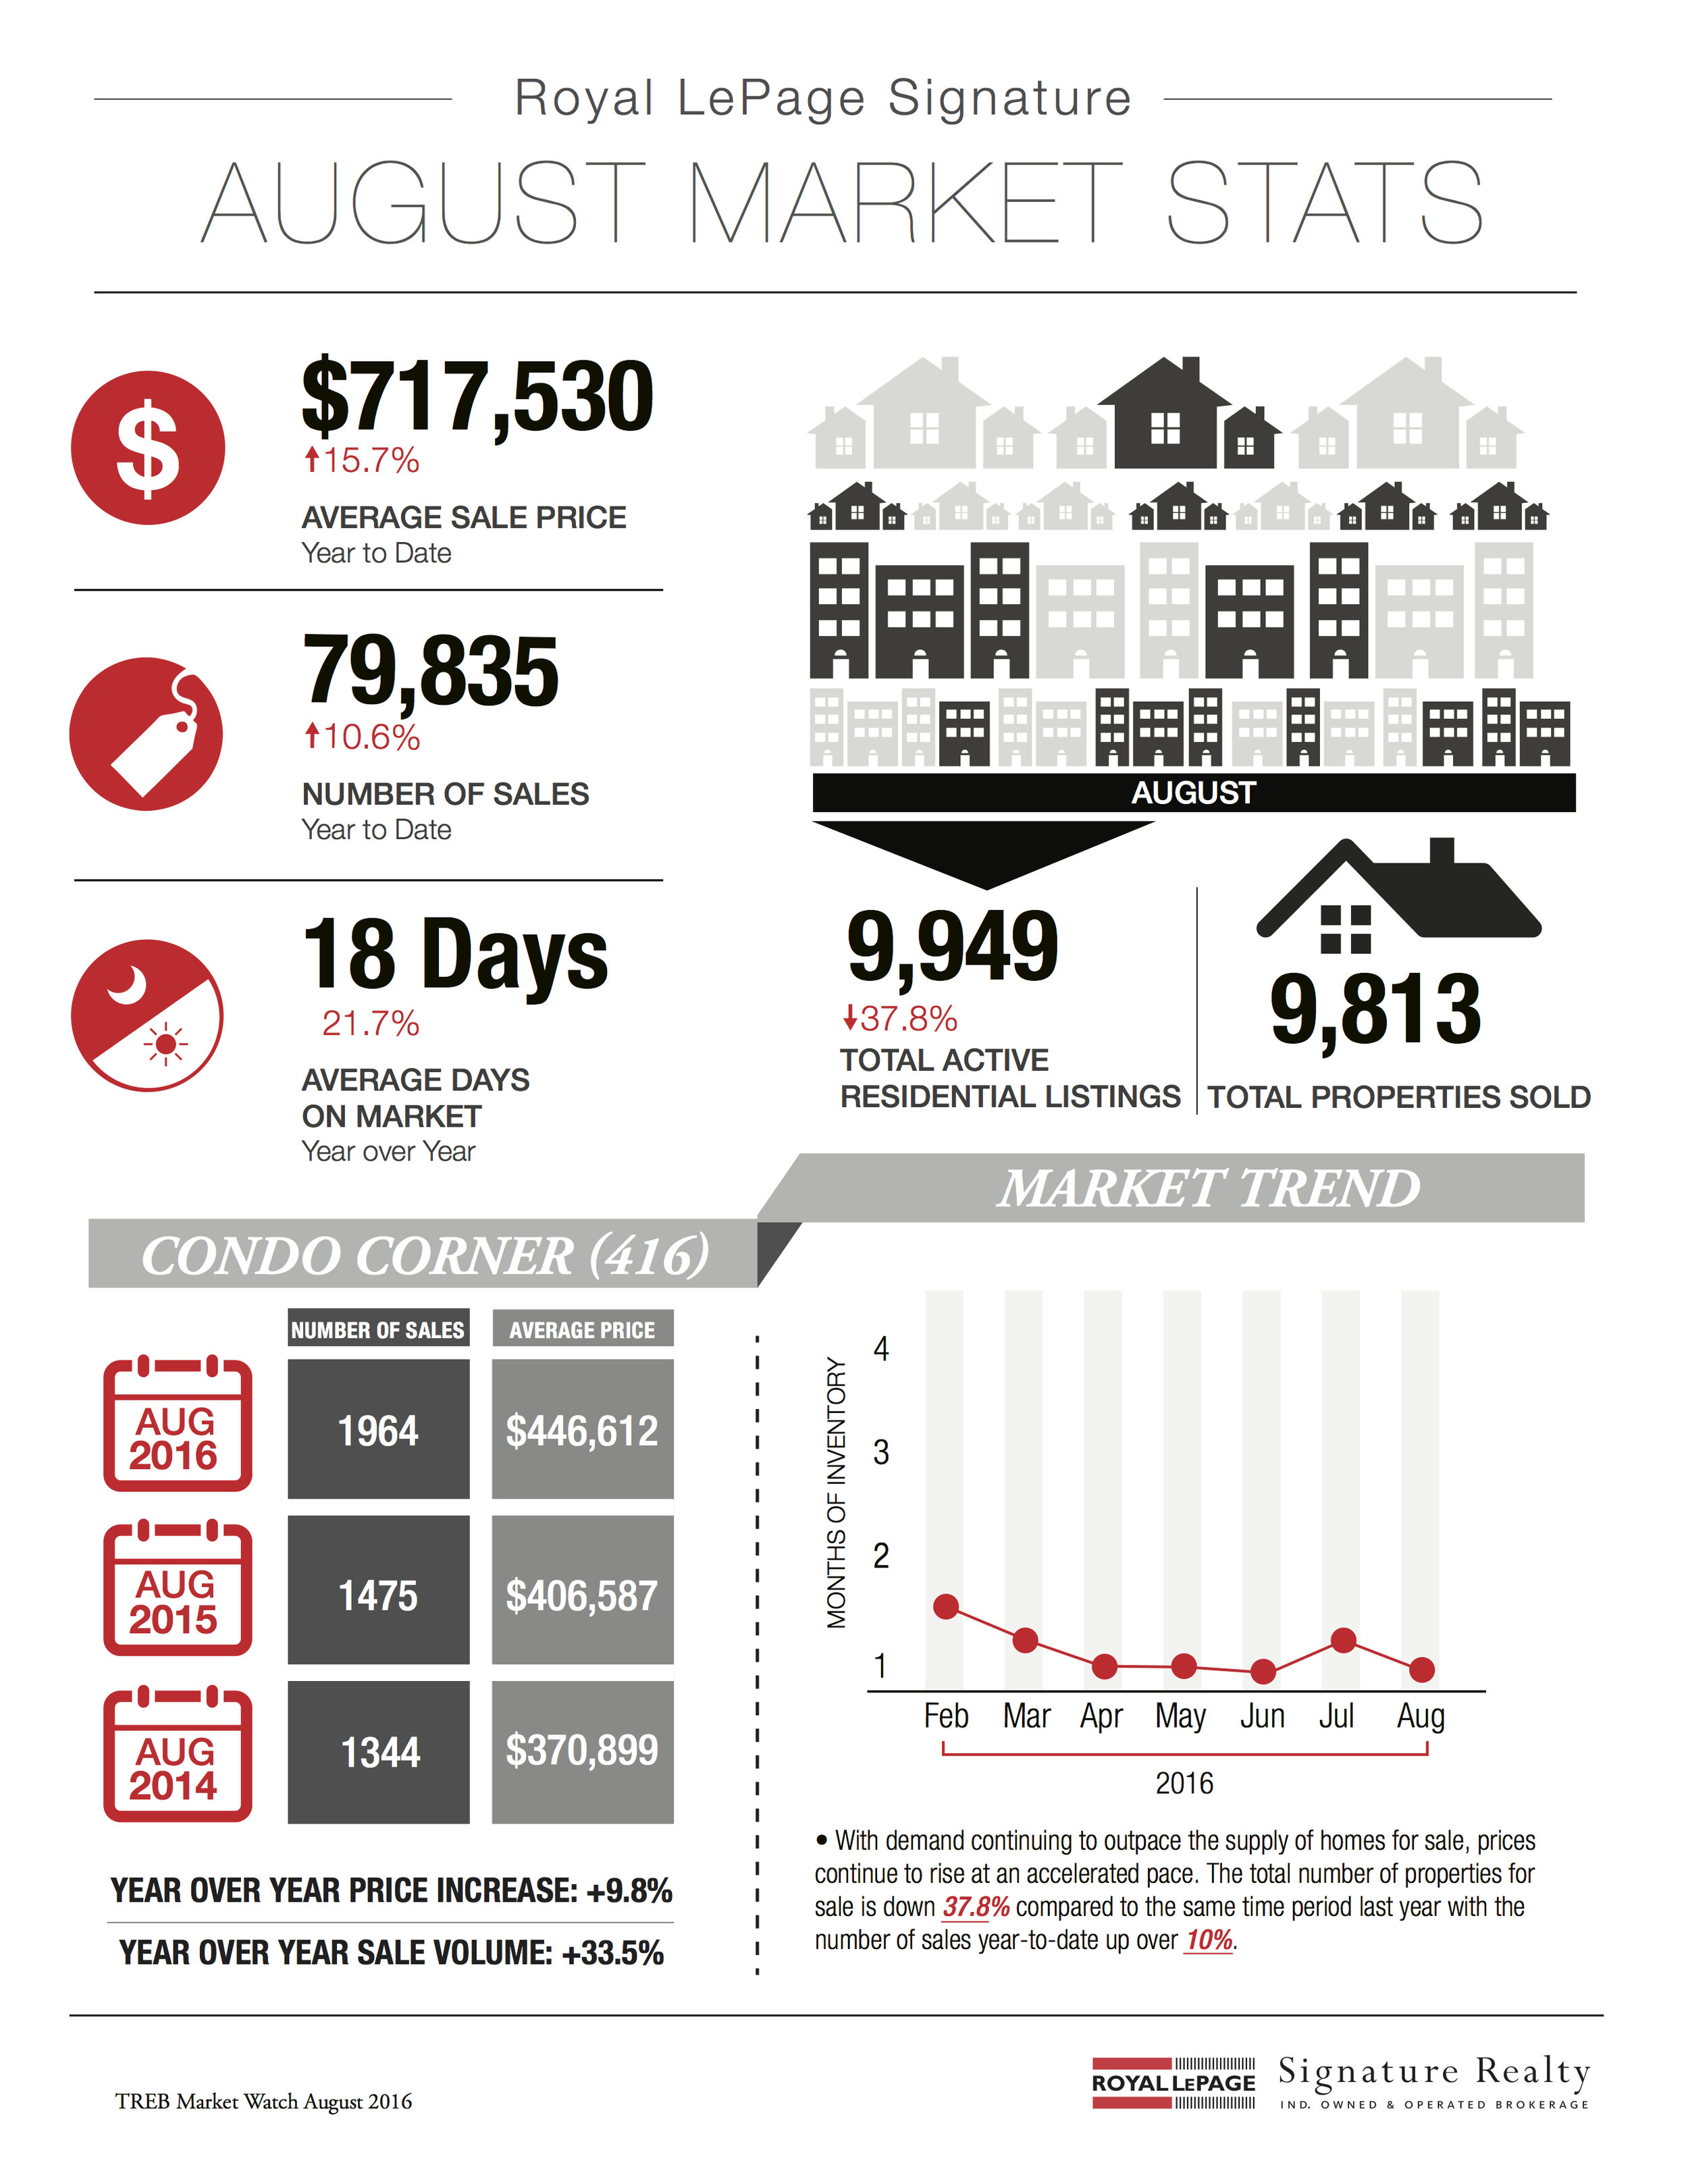
Toronto Real Estate Board President Larry Cerqua announced that Greater Toronto Area REALTORS® reported a record 9,813 sales through TREB’s MLS® System in August 2016.

While this sales result was 23.5 per cent above the number of transactions reported for August 2015, it is important to note that the majority of sales are reported on working days and there were two additional working days in August 2016 compared to 2015.

When the year-over-year discrepancy in working days is accounted for, the annual percentage change in sales is closer to 13 per cent.

“The conditions underlying strong demand for ownership housing remained in place, including a relatively strong regional economy, growth in average earnings and low borrowing costs. Unfortunately, we did not see any relief on the listings front, with the number of new listings down compared to last year. This situation continued to underpin very strong home price growth, irrespective of home type or area,” said Mr. Cerqua.

The MLS® Home Price Index (HPI) Composite Benchmark for August 2016 was up by 17.2 per cent on a year-over-year basis.

Similarly, the average selling price for all home types combined was up by 17.7 per cent on an annual basis to $710,410.

Both the MLS® HPI benchmarks and average prices for low-rise home types were up by double digits percentage-wise.

“Population in the GTA continues to grow. The resulting growth in households coupled with favourable economic conditions and low borrowing costs means that we remain on track for another record year for home sales. Against this backdrop, TREB will also be releasing new third-party research, and consumer and REALTOR® survey results throughout the fall and winter, with discussions focusing on foreign buying activity and issues affecting the supply of ownership housing,” said Jason Mercer, TREB’s Director of Market Analysis.


If you’re thinking of making a move and would like to know how I can help, feel free to contact me for more info.

For complete copies of TREB’s Monthly Market Watch Reports, visit my archives here.


June 2016 Market Stats: Infographic & Report

June 2016 Market Stats: Infographic & Report Photo Following is TREB’s market report for June 2016:
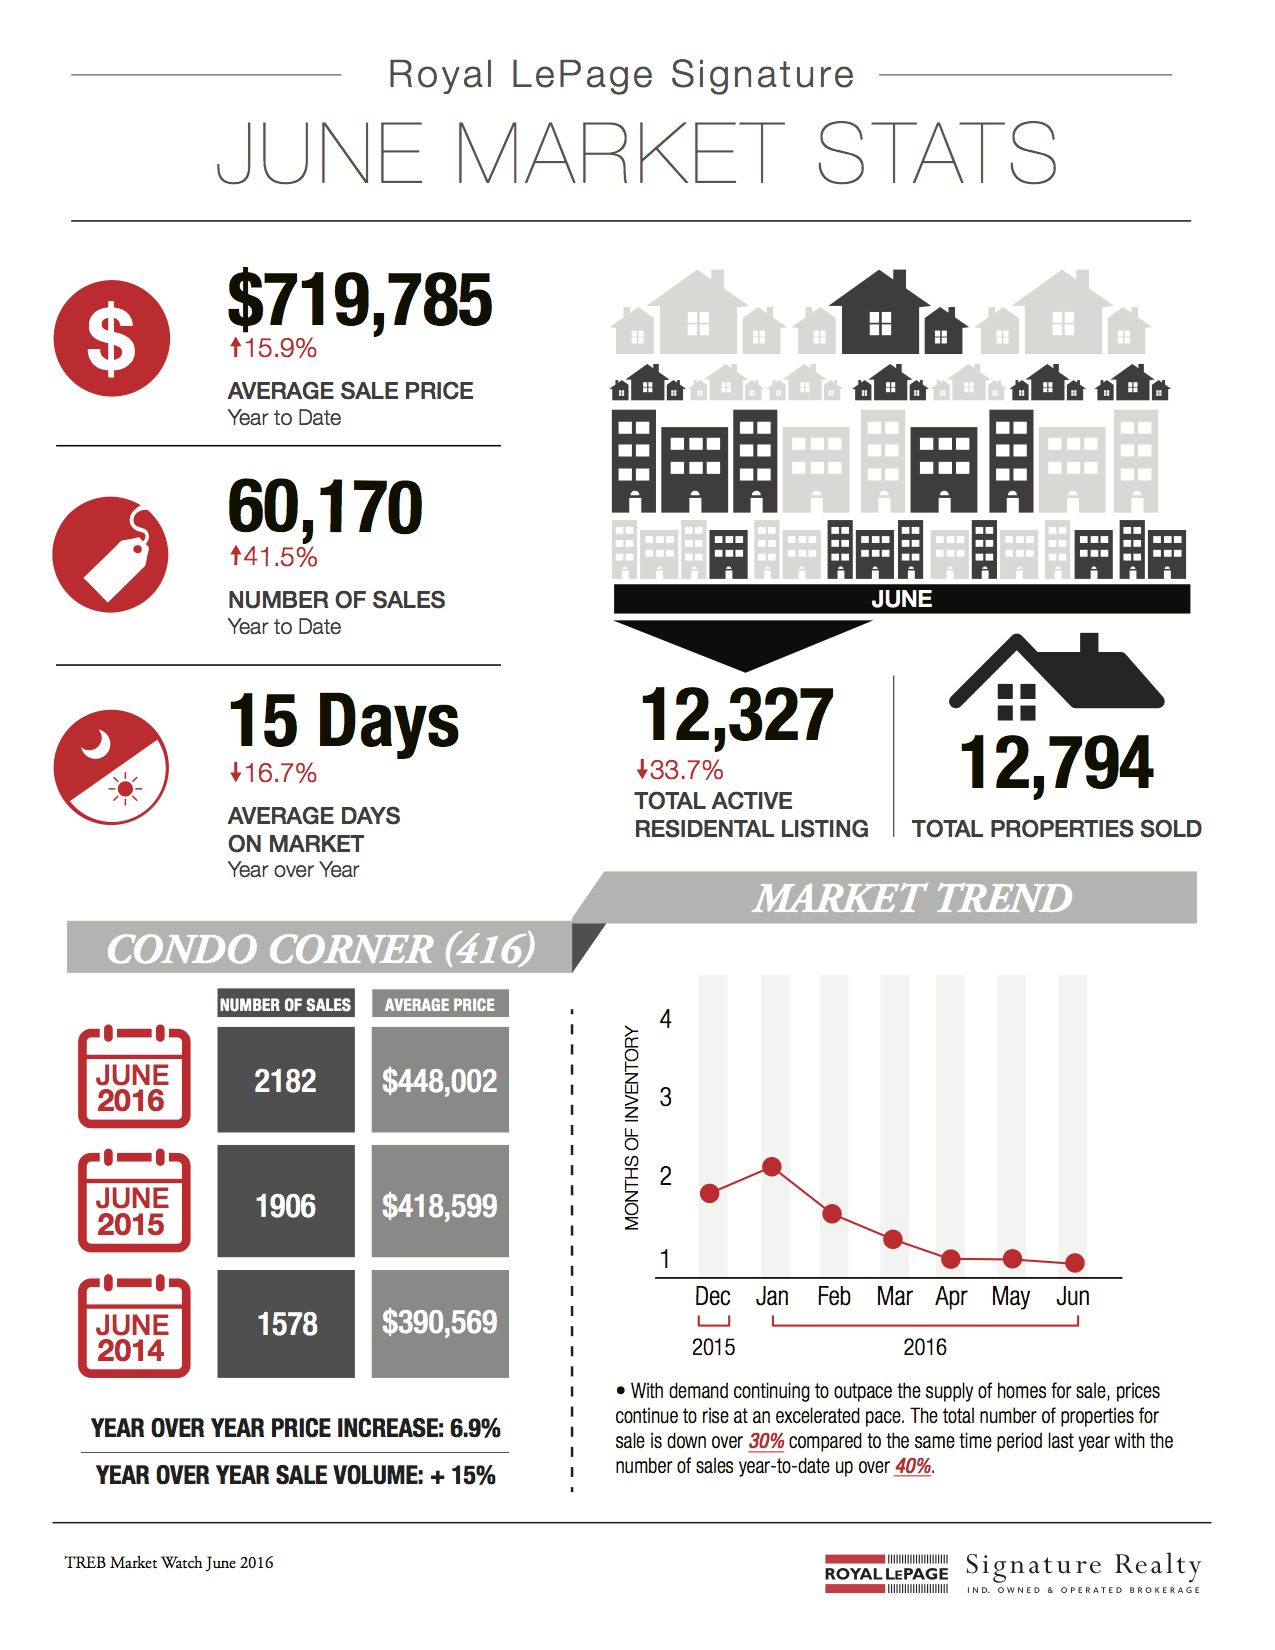
Toronto Real Estate Board President Larry Cerqua announced that Greater Toronto Area REALTORS® reported 12,794 residential transactions through TREB's MLS® System in June 2016.

This result was 7.5 per cent higher than the 11,905 sales reported in June 2015.

In line with the prevailing trend so far this year, the number of new listings was down by 3.8 per cent.

"As I start my term as TREB President, we are certainly in an interesting environment for ownership housing. There is no doubt that demand is at a record level, but would-be home buyers continue to face an uphill battle against a constrained supply of listings, which has perpetuated strong price growth. Buyers and sellers alike continue to benefit from the value a REALTOR® brings to a transaction," said Mr. Cerqua.

"As the federal, provincial and local levels of government discuss housing policy in the coming months, issues affecting the lack of supply in the GTA should be of paramount importance. TREB will be undertaking, and making public, results of additional research in the second half of 2016, with the goal of proactively adding to the housing policy discussion," added Mr. Cerqua.

The MLS® Home Price Index Composite Benchmark was up by 16 per cent on a year- overyear basis.

The average selling price for all home types combined was up by a slightly higher annual rate of 16.8 per cent to $746,546.

The single-detached, semi- detached and townhouse market segments led the way in terms of price growth.

"When TREB surveyed consumer intentions for 2016, we found that the majority of GTA households who were likely to purchase a home continued to be pointed towards some form of ground oriented housing. This is why we continue to see strong competition between buyers in many neighbourhoods where supply remains constrained," said Jason Mercer, TREB's Director of Market Analysis.


If you’re thinking of making a move and would like to know how I can help, feel free to contact me for more info.

For complete copies of TREB’s Monthly Market Watch Reports, visit my archives here.


Understanding Your 2016 Property Assessment Notice From MPAC

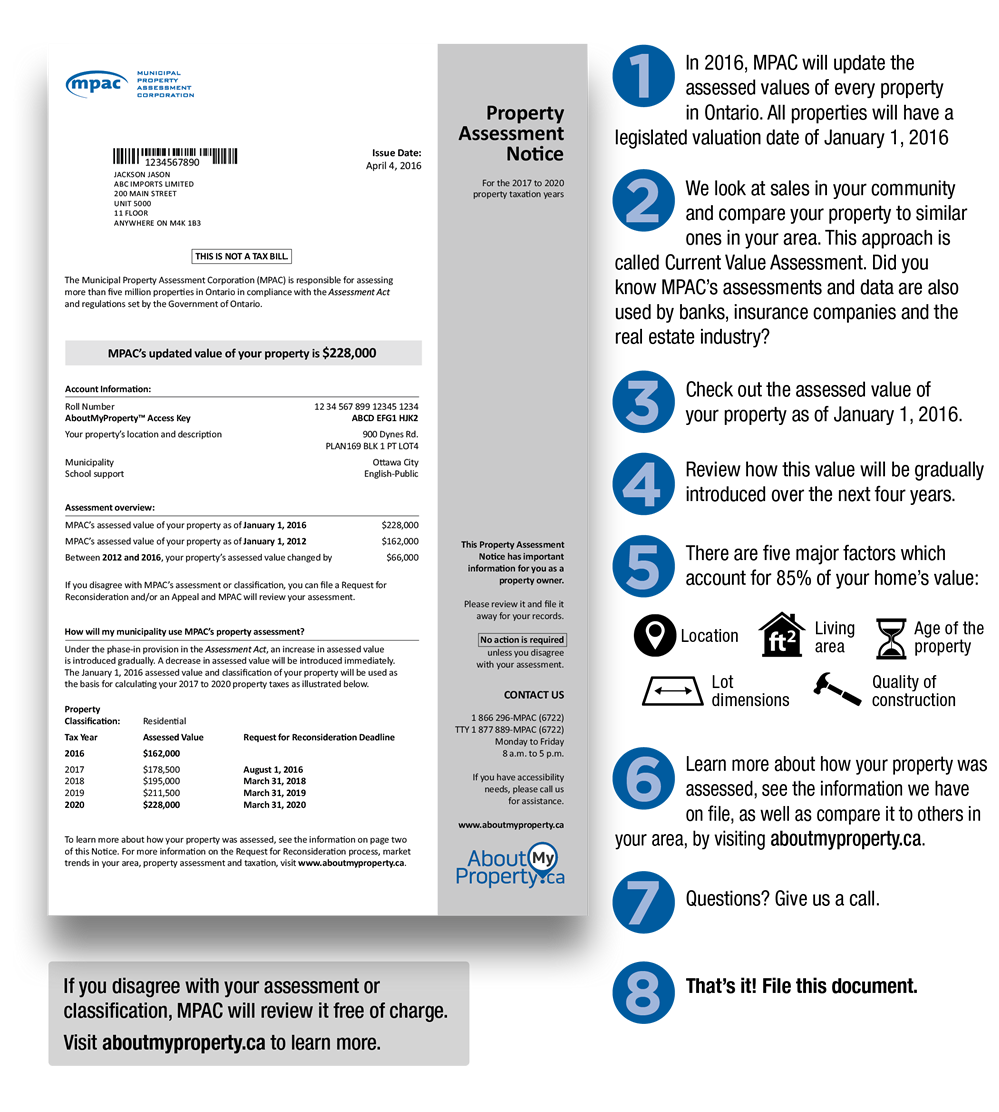
Understanding Your 2016 Property Value Assessment From MPAC Photo Back in April, MPAC started mailing out their 2016 property assessment notices to property owners across the province of Ontario. If you don’t have yours yet - keep checking the mail; they should all be out by the fall.
I’ve spoken to a number of clients recently about their assessments, and most are asking the same two questions:

  1. The assessed value is significantly less than what we know our property is worth. Is this normal?
  2. The assessed value has increased since the previous assessment. Does the municipality increase my property taxes by the same rate?

These are both excellent questions! Below are my answers.

The market value of your property is very likely going to be higher than MPAC’s assessed value.

While some assessments in the City of Toronto do come-in fairly close to market value, MPAC’s numbers are usually quite a bit lower than what the property would sell for on the open market. Sometimes the difference is quite significant!

It’s not uncommon to see MPAC’s assessed value be hundreds-of-thousands-of-dollars less than the current market value (depending of course on price point, location, etc.).

MPAC relies on a number of factors when doing their assessments, but apparently recent comparable sale prices don’t weigh heavily in the process!

Just because MPAC’s assessed value of your property has increased doesn’t necessarily mean you’ll pay more in property taxes.

In the City of Toronto, your property taxes should only increase if the value of your property has increased at a greater rate than the City average (unless of course the City has increased taxes as part of its budget requirements…).

Here’s a quote from the the FAQ section of the City’s property tax website:

  • Reassessment at the municipal level, is "revenue neutral" and does not generate any additional revenue for the City. With a reassessment, the City must adjust the tax rate to remain revenue neutral, so no new funding comes to the City of Toronto as a result of property valuation changes.
  • If your property value increases at a rate less than the City average, your property tax may decrease due to the reassessment.
  • If your property value increases at a rate more than the City average, your property tax will increase due to reassessment.
  • The City may need to increase taxes due to its budget requirements, however, this is separate and not related to reassessments.

Do you have any further questions about your assessment?

Maybe MPAC’s valuation actually seems too high to you, and you’re wondering if there’s cause to fight it? Give me a shout and I’ll be happy to provide you with the recent sales in your area. Who knows, you might be able to make a case…


If you’re thinking of making a move and would like to know how I can help, feel free to contact me for more info.

May 2016 Market Stats: Infographic & Report

Following is TREB’s market report for May 2016: Toronto Photo Following is TREB’s market report for May 2016:
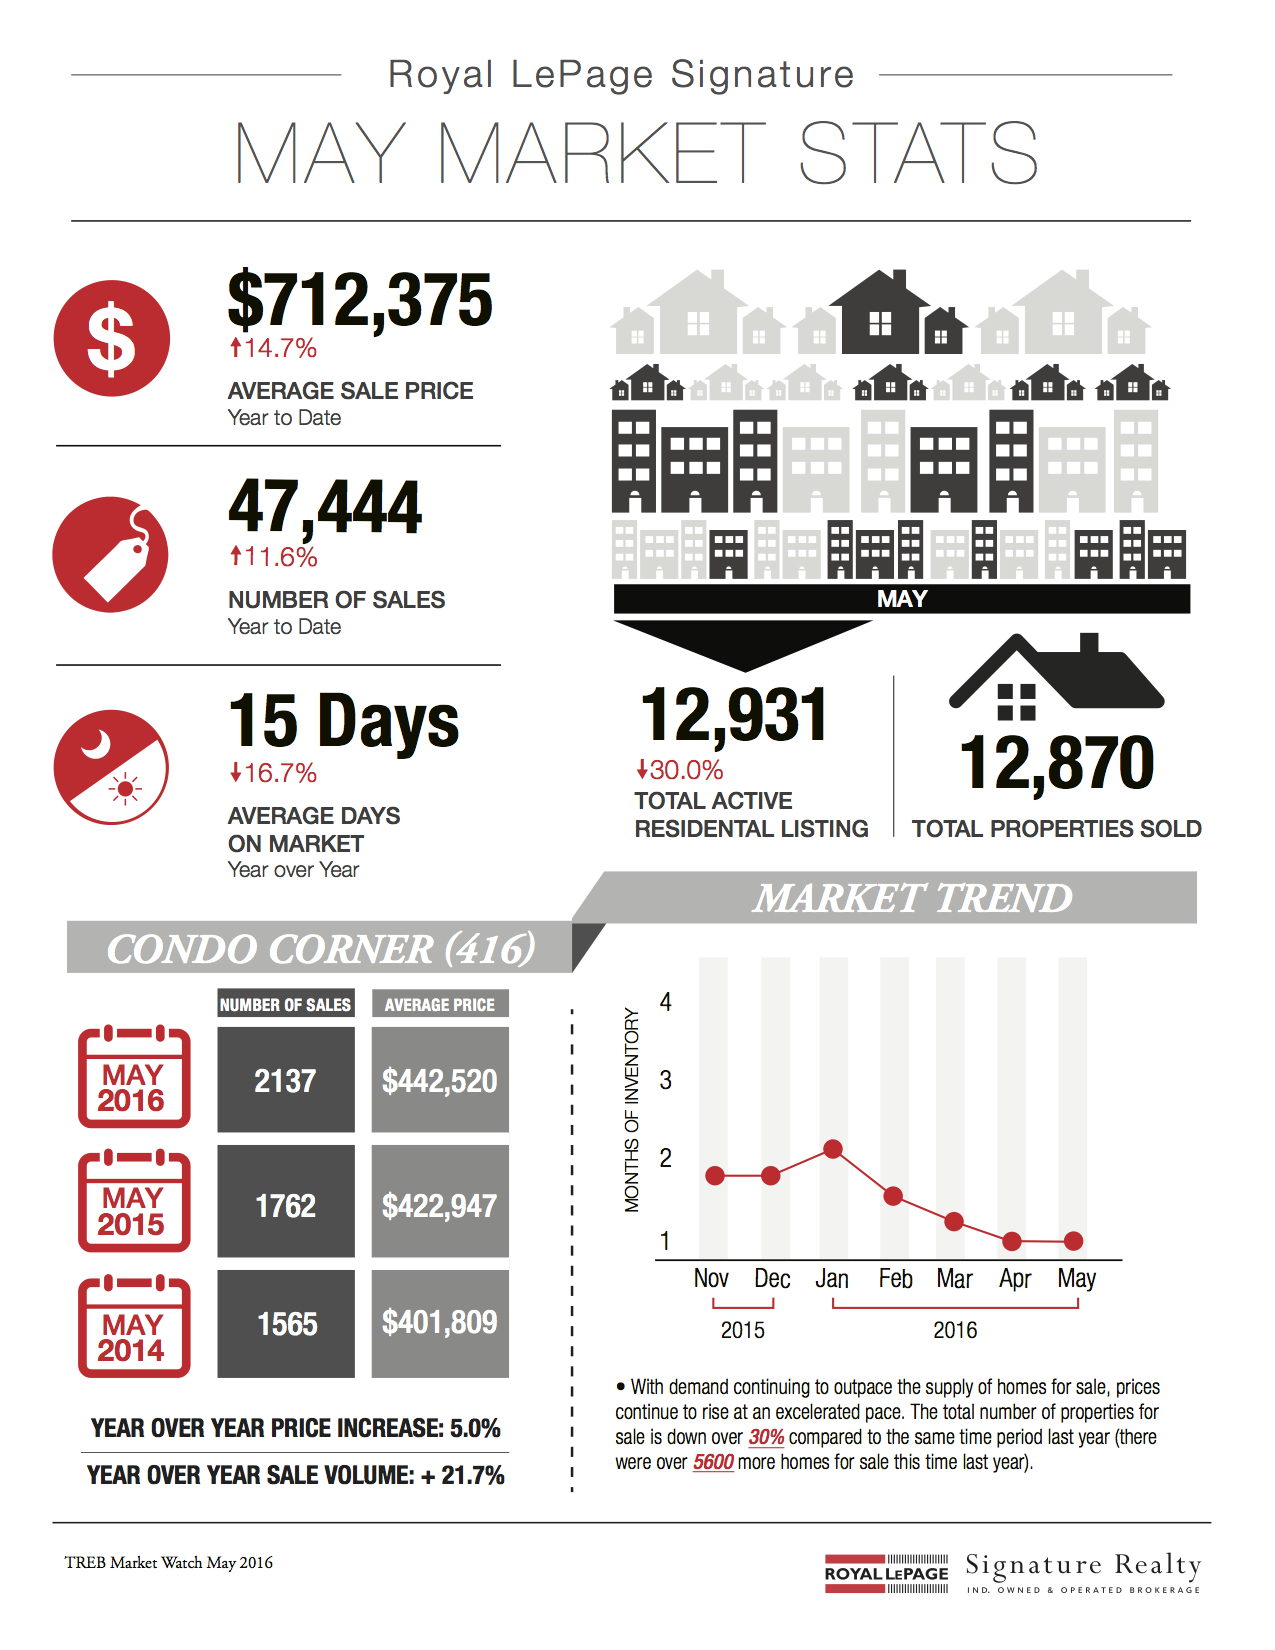
Toronto Real Estate Board President Mark McLean announced that there were 12,870 home sales reported through TREB's MLS® System in May 2016.

This result represented a new record for the month of May and a 10.6 per cent increase over the same period last year.

In contrast, the number of new listings was down over the same time frame by 6.4 per cent.

The decline in listings was experienced in both the low-rise and condominium apartment market segments.

"Whether we're talking about existing homeowners or people looking to purchase for the first time, there is no shortage of buyers in the marketplace today. So, while the record number of home sales through the first five months of 2016 is not necessarily surprising, it does sometimes mask the larger story in the GTA: the shortage of listings, which has resulted in strong upward pressure on home prices," said Mr. McLean.

The MLS® Home Price Index Composite Benchmark was up by 15 per cent year-over-year in May 2016.

Similarly, the average selling price for all home types combined was up by 15.7 per cent over the same period.

Low-rise home types, which remained in short supply in many GTA neighbourhoods, experienced the strongest price growth.

"Widespread competition between buyers of singles, semis and townhouses across the GTA has underpinned the robust annual rates of price growth experienced so far this year. With this said, however, it is also important to understand that tighter market conditions for condominium apartments have resulted in price growth well above the rate of inflation in this market segment as well," said Jason Mercer, TREB's Director of Market Analysis.


If you’re thinking of making a move and would like to know how I can help, feel free to contact me for more info.

For complete copies of TREB’s Monthly Market Watch Reports, visit my archives here.


April 2016 Market Stats: Infographic & Report

April 2016 Market Stats: Infographic & Report Photo Following is TREB’s market report for April 2016:

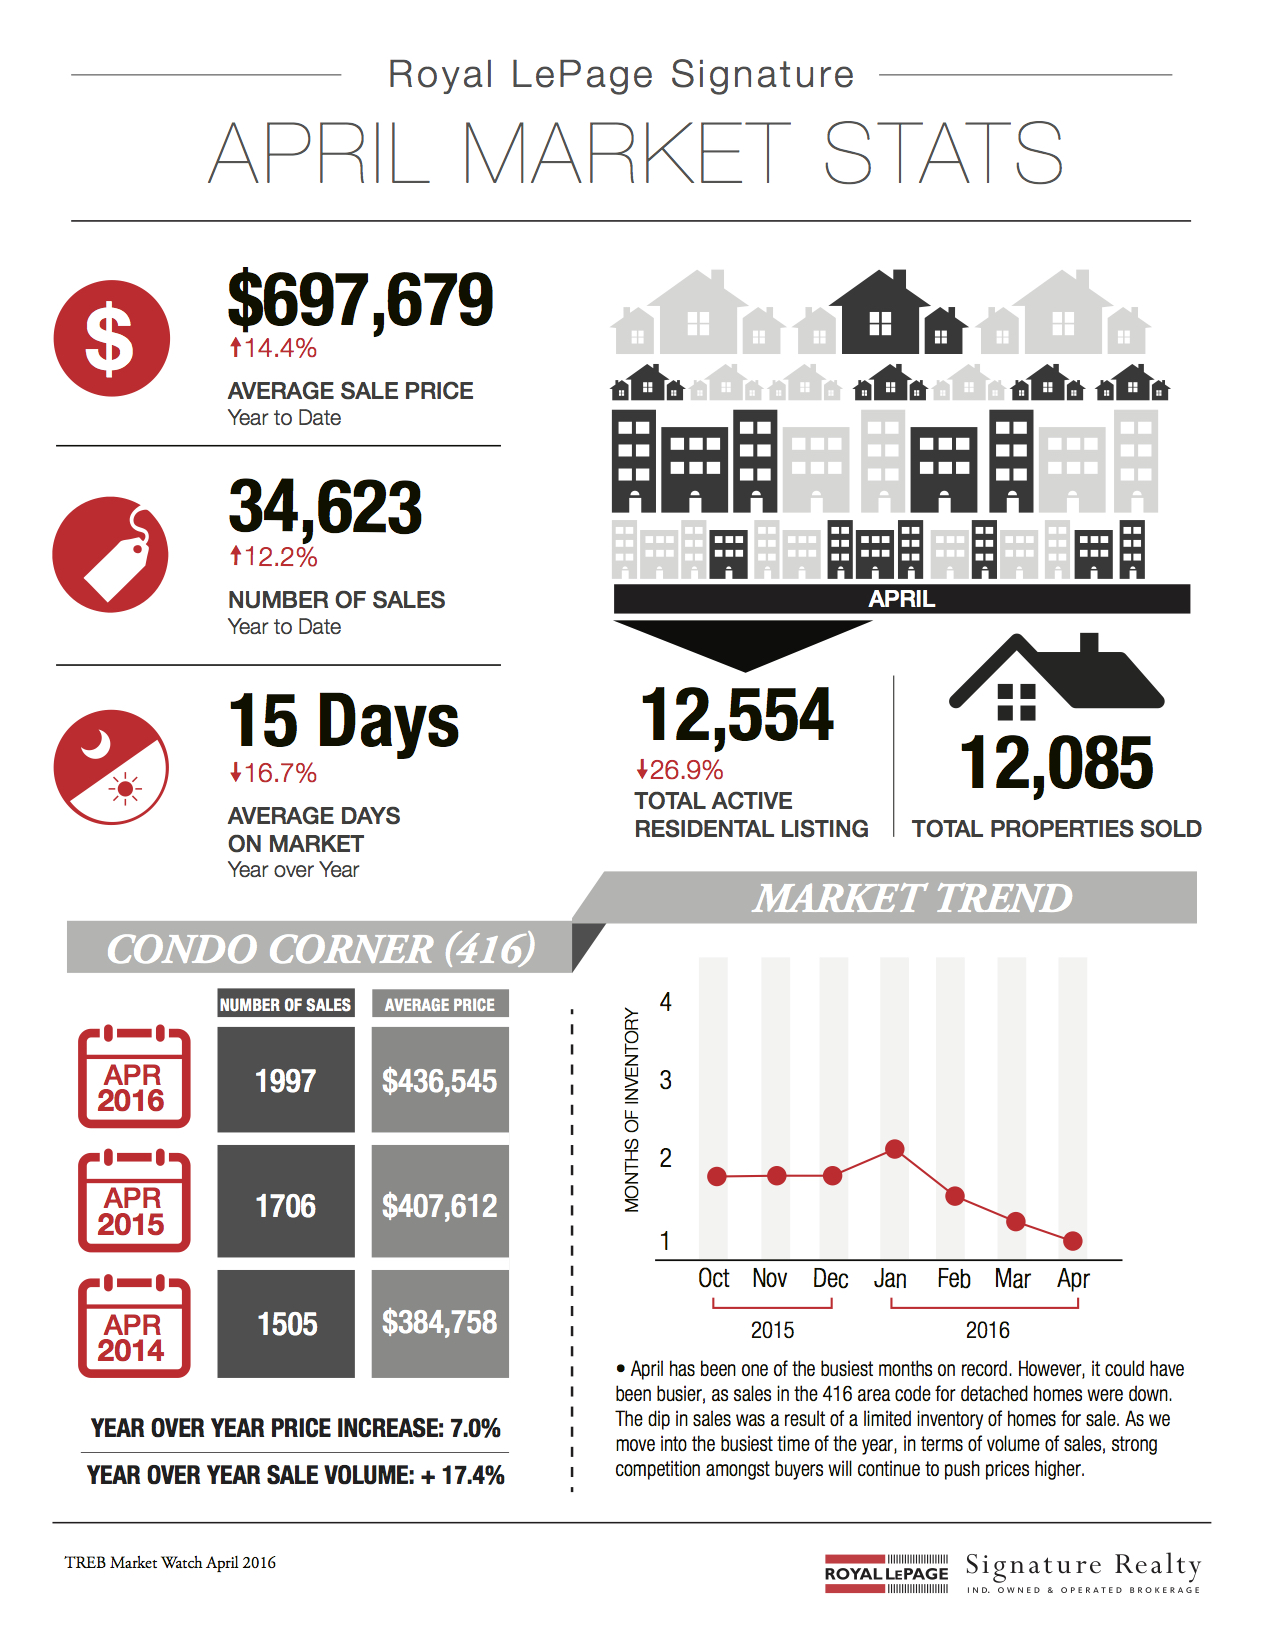
Toronto Real Estate Board President Mark McLean announced that there were 12,085 sales reported through TREB’s MLS® System in April 2016.

This result, which represented a record for the month of April, was up by 7.4 per cent in comparison to April 2015.

For the TREB market area as a whole, annual sales growth was experienced for all major home types except semi-detached houses.

In the City of Toronto, sales were down for detached and semi-detached houses as well as townhouses on a year-over-year basis.

This dip in sales in the “416” area code was due to a lack of low-rise listings.

Many would-be buyers were not able to find a home that met their needs.

“Demand remained strong for all types of ownership housing. This suggests that Canadians continue to see the value in investing in homeownership, and on May 17, I encourage all homeowners to celebrate with us on National Real Estate Day,” said Mr. McLean.

“While April’s sales result represented a new record for sales, that number could have been even higher if we had benefitted from more supply. In the City of Toronto in particular, some households have chosen not to list their home for sale because of the second substantial Land Transfer Tax and associated administration fee. The lack of available inventory, coupled with record sales, continued to translate into robust annual rates of price growth,” continued Mr. McLean.

Home selling prices continued to trend upward in April.

The MLS® Home Price Index Composite Benchmark was up by 12.6 per cent year-over-year.

The average selling price was up by 16.2 per cent.

The higher growth rate reported for the average home price, as compared to the MLS® HPI, points to a greater share of high-end home sales this year compared to last.

“As we move into the busiest time of the year, in terms of sales volume, strong competition between buyers will continue to push home prices higher. A greater supply of listings would certainly be welcome, but we would need to see a number of consecutive months in which listings growth outpaced sales growth before market conditions become more balanced,” said Jason Mercer, TREB’s Director of Market Analysis.


If you’re thinking of making a move and would like to know how I can help, feel free to contact me for more info.

For complete copies of TREB’s Monthly Market Watch Reports, visit my archives here.