Does My Deposit Cheque Need To Be Certified?

Certified-Stamp1.jpg

In my recent blog post on real estate deposits (read it here) I answered some of the key questions that my clients often have: “How much should the deposit be?”  “When is the deposit due?” 

There’s another question that often gets asked and deserves a little attention here: “Does my deposit cheque need to be certified?”

In every MLS listing there’s a section towards the bottom for “broker’s remarks” (note: these remarks aren’t available on the public versions of listings). 

It’s in this section where listing agents will specify things like showing restrictions, offer dates, etc. 

And it’s here that we’ll often see the instruction, “deposit to be certified”.

Why Does The Seller Want My Deposit Cheque To Be Certified?

A seller wants a certified cheque because it gives them greater peace-of-mind than a standard personal cheque does. 

A certified cheque tells the seller a few very important things:

  • The buyer went to the trouble of walking into a bank and paying $5.00 - $10.00 to have the cheque drawn up.

  • The buyer is serious and is submitting their offer with the genuine intent of purchasing.

  • The buyer does indeed have the deposit funds available.

  • The cheque can be deposited immediately into the Listing Brokerage’s trust fund and there’s no worry as to whether or not the funds will clear.

Not to say that a buyer who's only providing a personal cheque isn't serious or doesn't have the funds available... 

It's just that a certified cheque holds more weight in most sellers' eyes.

Give Yourself The Upper Hand When Competing With Other Buyers

In a seller’s market, where buyers are doing everything they can to set their offer apart from the competition, having the deposit certified is a must. 

I’ve seen a buyer with the highest offer actually lose out to someone with a lower offer simply because the lower offer came with a certified deposit cheque. 

In this case, the seller wanted to rest easy that night knowing that it was a done deal and he was willing to pay (in the form of selling for a bit less) for that peace-of-mind.

Can I Provide A Bank Draft Instead?

In my experience, a bank draft is just as good as a certified cheque. 

I’ve never had a listing agent show preference of one over the other and both seem to hold the same weight with sellers. 

And bank drafts are sometimes a bit cheaper/easier to obtain (be sure to check with your banker which option is best for you).

If you’re thinking of making a move and would like to know how we can help, contact us for more info.

September 2018 Market Stats: Infographic & Report

 
2018-10-05 - September Market Stats.jpg
 

September 2018 market stats are here!

The average sale price for the month was $796,786, up 2.9% compared to September 2017.

Here’s a breakdown of the average sale prices & year-over-year increases/decreases for the 416 area code:

  • Detached = $1,342,363 (-1.4%)

  • Semi-Detached = $995,951 (+6.3%)

  • Townhouse = $743,721 (+8.2%)

  • Condo Apartment = $615,582 (+11.7%)

And here’s TREB’s official market report for the month of September 2018:

Toronto Real Estate Board President Garry Bhaura announced that Greater Toronto Area REALTORS® reported 6,455 sales through TREB's MLS® System in September 2018 – up 1.9 per cent compared to September 2017.

The average selling price for September 2018 sales was up by 2.9 per cent over the same period to $796,786.

The MLS® HPI composite benchmark price was up by two per cent year-over-year.

New listings entered into TREB's MLS® System in September 2018 amounted to 15,920 – down by 3.1 per cent compared to September 2017.

With sales up year-over-year and new listings down, market conditions became tighter.

Many buyers may have found it more difficult to find a home meeting their needs.

"It is healthy to see sales and prices in many areas across the Greater Toronto Area up a bit, compared to last year's lows. At the same, however, it is important to remember that TREB's market area is made up of over 500 communities. Market conditions have obviously unfolded differently across these communities. This is why it's important to work with a REALTOR® who is familiar with local market conditions in your areas of interest," said Mr. Bhaura.

"While higher borrowing costs and tougher mortgage qualification rules have kept sales levels off the record pace set in 2016, many households remain positive about home ownership as a quality long-term investment. As the GTA population continues to grow, the real challenge in the housing market will be supply rather than demand. The Toronto Real Estate Board is especially concerned with issues affecting housing supply as we move towards municipal elections across the region," added Mr. Bhaura.

On a monthly basis, after preliminary seasonal adjustment, sales edged up by 0.2 per cent in September 2018 compared to August 2018.

The average selling price, after preliminary seasonal adjustment, edged lower by 0.5 per cent month-over-month.

"Generally speaking, annual rates of price growth have been stronger for higher density home types in 2018, including condominium apartments, townhouses and semi-detached houses. In many neighbourhoods, these home types provide more affordable home ownership options. This is why a policy focus on increasing mid-density housing options throughout the GTA is important," said Jason Mercer, TREB's Director of Market Analysis.

If you’re thinking of making a move and would like to know how we can help, please contact us for more info.

Elements Of An Offer Explained: The Deposit

Deposit-Cheque1.jpg

An offer-to-purchase real estate is made up of many elements, some of which are arguably more important than others. 

In most cases, price sits at the top of the list. 

Conditions are another biggie, followed by any significant clauses, the closing date, inclusions, exclusions... 

And of course, one of the most important elements of an offer – the deposit.

The deposit forms a few key functions. 

First, it shows good faith on the buyer’s part and gives the seller peace-of-mind that the person they’re dealing with is qualified and sincere. 

Secondly, the deposit amount is applied to the purchase price of the home when the sale closes.

How Much Should The Deposit Be?

There’s no set amount when it comes to real estate deposits, but 5% of the purchase price is generally a good rule of thumb. 

Having said that, I’ve seen deposits of less than 5%, especially when it comes to first-time buyers (eg. $20,000 on a $500,000 property). 

Deposits of greater than 5% are not out of the ordinary either. 

We see these often in multiple-offer scenarios, where buyers are doing everything they can to give themselves the upper hand over their competition.

When Is The Deposit Due?

The pre-printed deposit section of an Agreement of Purchase and Sale gives three options for when the deposit is to be paid: Herewith, Upon Acceptance, or as otherwise described in this Agreement

The following image is a screenshot of the Deposit clause as it appears on the standard APS:

Elements Of An Offer Explained: The Deposit Photo

Elements Of An Offer Explained: The Deposit Photo

You can see that "Upon Acceptance" means that the deposit is to be delivered to the Deposit Holder (most often the Listing Brokerage) within 24 hours of the acceptance of the Agreement. 

"Herewith" is just as it sounds, the deposit is submitted along with the offer. 

"As otherwise described in this Agreement" can mean a few things. 

The buyer and seller may agree, for example, that the deposit be delivered within 48 hours (as opposed to 24 hours). 

Or they may agree to an initial deposit PLUS subsequent additional deposit(s) upon removal of conditions. 

For example, the buyer will fork over $10,000 now and then an additional $5,000 once they secure financing.

Aside from "How Much?" and "When?", another common question I get from buyers is, "Does My Deposit Cheque Need To Be Certified?"  

This is a great question... Stay tuned for a future blog post in which I'll give the answer.

If you’re thinking of making a move and would like to know how we can help, please contact us for more info.

August 2018 Market Stats: Infographic & Report

 
2018-09-06 - August Market Stats.jpg
 

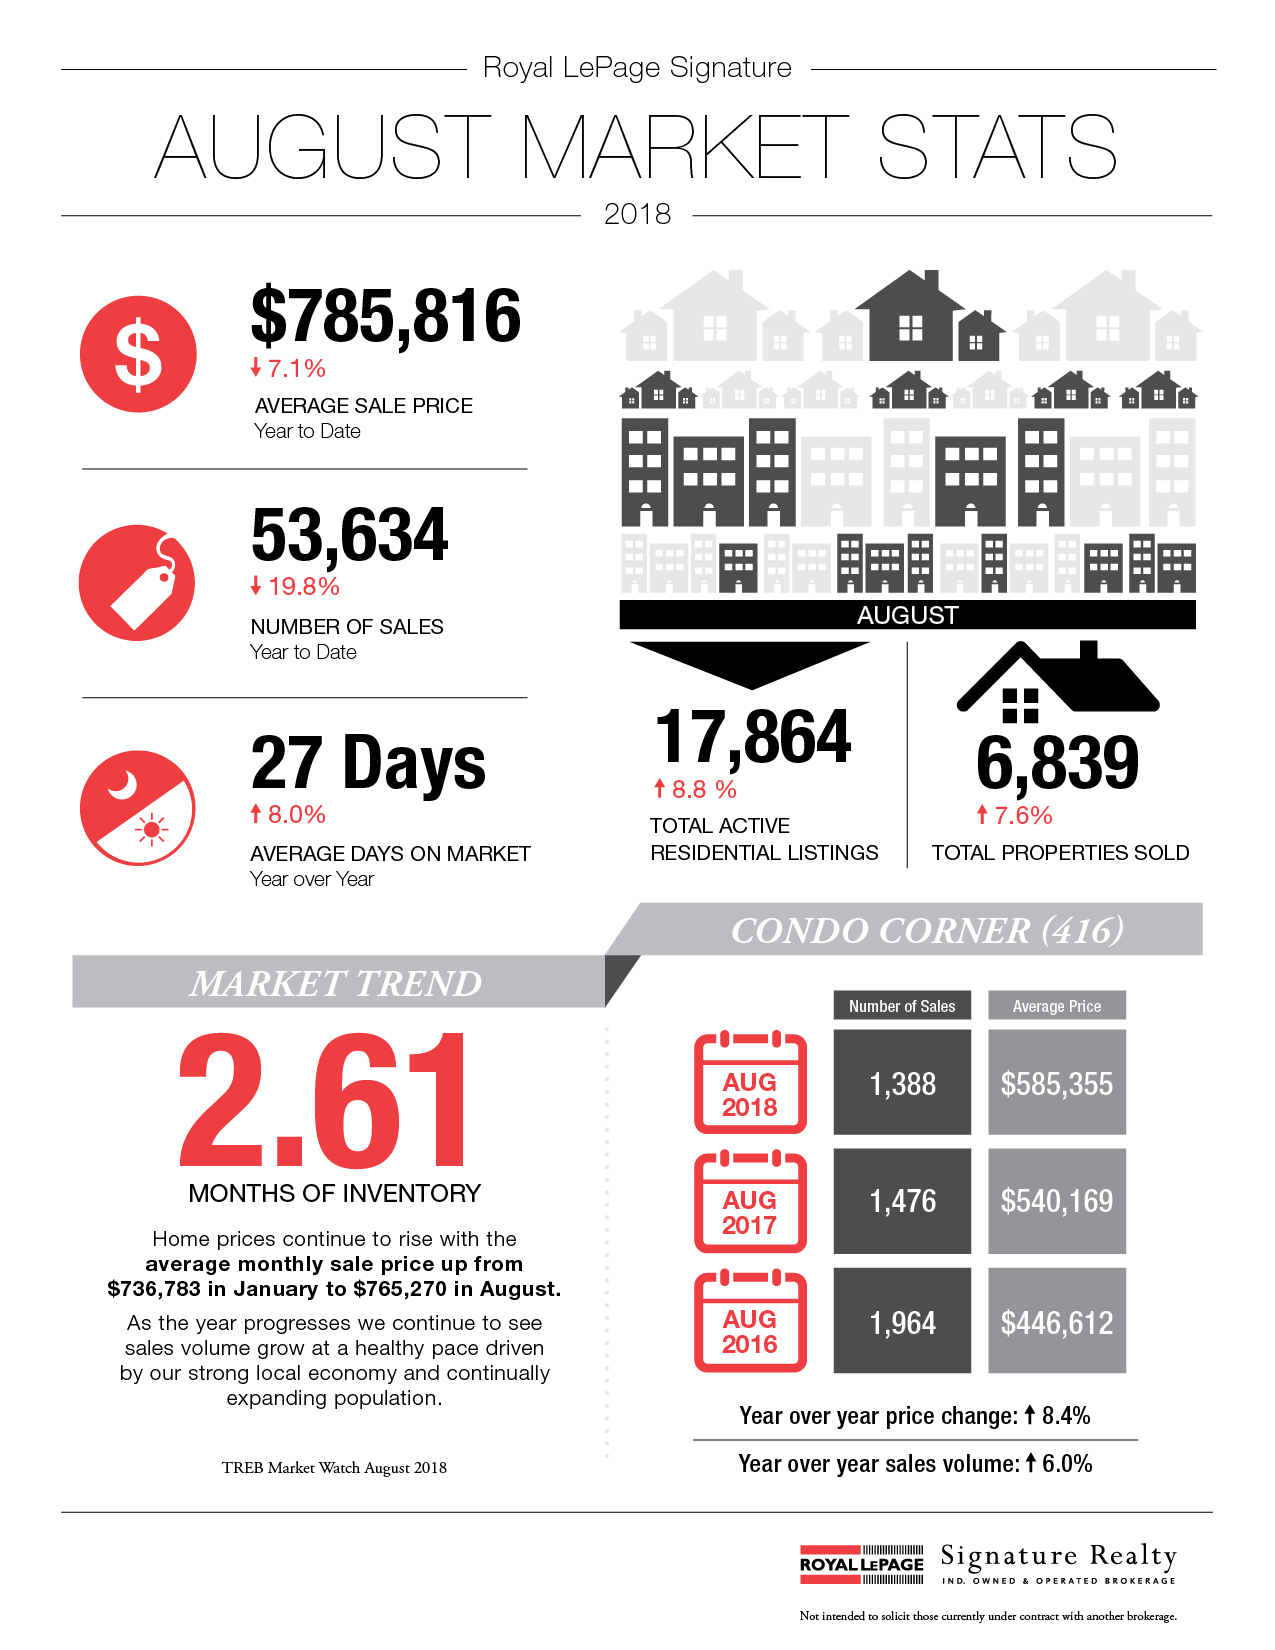
August 2018 market stats are here!

The average sale price for the month was $765,270, up 4.7% compared to August 2017.

Here’s a breakdown of the average sale prices & year-over-year increases/decreases for the 416 area code:

  • Detached = $1,244,275 (+4.9%)

  • Semi-Detached = $891,208 (-0.5%)

  • Townhouse = $683,160 (-0.1%)

  • Condo Apartment = $585,355 (+8.3%)

And here’s TREB’s official market report for the month of August 2018:

Toronto Real Estate Board President Garry Bhaura announced sales and price increases on a year-over-year basis in August.

Greater Toronto Area REALTORS® reported 6,839 sales through TREB’s MLS® System in August 2018 – an 8.5 per cent increase compared to August 2017.

Both the average selling price, at $765,270, and the MLS® Home Price Index Composite Benchmark for August 2018 were up compared to the same month in 2017, by 4.7 per cent and 1.5 per cent respectively.

The average selling price increased by more than the MLS® HPI Composite due, at least in part, to a change in the mix of sales compared to last year.

Detached home sales were up by double digits on a year-over-year percentage basis – substantially more than many other less-expensive home types.

“It is encouraging to see a continued resurgence in the demand for ownership housing. Many home buyers who had initially moved to the sidelines due to the Ontario Fair Housing Plan and new mortgage lending guidelines have renewed their search for a home and are getting deals done much more so than last year. In a region where the economy remains strong and the population continues to grow, ownership housing remains a solid long-term investment,” said Mr. Bhaura.

Month-over-month sales and price growth also continued in August.

On a preliminary seasonally adjusted basis, August 2018 sales were up by two per cent compared to July 2018.

The seasonally adjusted August 2018 average selling price was down slightly by 0.2 per cent compared to July 2018, following strong monthly increases in May, June and July.

“Market conditions in the summer of 2018, including this past August, were tighter than what was experienced in the summer of 2017. In August, the annual rate of sales growth outpaced the annual rate of new listings growth. We only have slightly more than two-and-a-half months of inventory in the TREB market area as a whole and less than two months of inventory in the City of Toronto. This means that despite the fact the sales remain off the record highs from 2016 and 2017, many GTA neighbourhoods continue to suffer from a lack of inventory. This could present a problem if demand continues to accelerate over the next year, which is expected,” said Jason Mercer, TREB’s Director of Market Analysis.

If you’re thinking of making a move and would like to know how we can help, please contact us for more info.

The Importance Of Having A Mortgage Pre-Approval

Mortgage-Pre-Approval.jpg

When I meet with a new buyer client, one of the very first questions I ask is, “Have you been pre-approved for a mortgage?” 

More often than not, they’ve haven’t. 

Sure, they’ve done a bit of research on their own; plugged some numbers into an online mortgage calculator, crunched a few more numbers to see what they’re comfortable spending each month...  

Don’t get me wrong – this preliminary leg work is great in that it gives you a ballpark idea of what you’re in the market for. 

It’s not the same as having an actual pre-approval though.

What Is A Mortgage Pre-Approval?

Generally, you can get pre-qualified for a mortgage over the phone or online. 

You provide a breakdown of your employment history, your income, a list of assets and liabilities, and an approximate down payment amount. 

Based on this info, your mortgage broker will let you know how much you’re pre-qualified to spend and what sort of interest rate they can offer you.

An actual pre-approval is a bit different. 

It takes the process a step further by having you complete a mortgage application and provide your mortgage broker with the necessary documentation to verify the info provided in your pre-qualification (income verification letter from employer, banking info, proof of financial assets and liabilities, source and amount of down payment and deposit, proof of source of funds to cover closing costs, etc.).

I stress to my clients that having an actual pre-approval in place is essential.  Here are a few of the key reasons why:

Knowing What You Can Afford

There no sense in shopping for a Jalopy if you can easily afford a Jaguar. 

By the same token, why waste your time on a Jaguar if you’re really in the market for a Jeep? 

A mortgage pre-approval gives buyers a firm budget to work with. 

It helps to streamline the home searching process and allows us to focus specifically on those properties that are within reach.

Locking In An Interest Rate

A mortgage pre-approval locks in a current interest rate for you, for a period of a few months. 

If rates start to increase while you’re out shopping for a home, you’re guaranteed the original, lower rate. 

If rates actually go down while you’re out shopping, you’ll get the new, lower rate. 

It’s a win-win situation.

Giving You The Upper Hand Over Other Buyers

It’s common knowledge that the Toronto real estate market can be highly competitive, especially for buyers. 

It helps when I can tell sellers that my buyer clients have been pre-approved. 

It gives the sellers some peace-of-mind and reassures them that they’re dealing with serious, qualified purchasers. 

And of course being pre-approved helps when there are multiple offers. 

Sellers are much more likely to work with an offer that doesn’t have a financing condition in it.  

I've actually seen sellers reject the highest priced offer because it had a financing condition in it and accept a lower priced offer because it didn't.

In a real estate market that's as active as Toronto's, any advantage you can give yourself is going to make a difference  

A mortgage pre-approval is key in giving you the power to act quickly and confidently when the right property comes along.  

Happy hunting!

If you’re thinking of making a move and would like to know how we can help, please contact us for more info.

July 2018 Market Stats: Infographic & Report

 
2018-08-05 - July Market Stats.jpg
 

July 2018 market stats are here!

The average sale price for the month was $782,129, up 4.8% compared to July 2017.

Here’s a breakdown of the average sale prices & year-over-year increases/decreases for the 416 area code:

  • Detached = $1,350,700 (+3.6%)

  • Semi-Detached = $935,300 (+7.4%)

  • Townhouse = $718,698 (+1.5%)

  • Condo Apartment = $582,547 (+9.2%)

And here’s TREB’s official market report for the month of July 2018:

Toronto Real Estate Board President Garry Bhaura announced strong growth in the number of home sales and the average selling price reported by Greater Toronto Area REALTORS® in July 2018.

“Home sales result in substantial spin-off benefits to the economy, so the positive results over the last two months are encouraging. However, no one will argue that housing supply remains an issue. The new provincial government and candidates for the upcoming municipal elections need to concentrate on policies focused on enhancing the supply of housing and reducing the upfront tax burden represented by land transfer taxes, province-wide and additionally in the City of Toronto,” said Mr. Bhaura.

Residential sales reported through TREB’s MLS® System for July 2018 amounted to 6,961 – up 18.6 per cent compared to July 2017.

Over the same period, the average selling price was up by 4.8 per cent to $782,129, including a moderate increase for detached home types.

New listings in July 2018 were down by 1.8 per cent year-over-year.

Preliminary seasonal adjustment pointed to strong month-over-month increases of 6.6 per cent and 3.1 per cent respectively for sales and average price.

Seasonally adjusted sales were at the highest level for 2018 and the seasonally adjusted average price reached the highest level since May 2017.

The MLS® Home Price Index (HPI) Composite Benchmark for July 2018 was down slightly compared to July 2017.

However, the annual growth rate looks to be trending toward positive territory in the near future.

“We have certainly experienced an increase in demand for ownership housing so far this summer. It appears that some people who initially moved to the sidelines due to the psychological impact of the Fair Housing Plan and changes to mortgage lending guidelines have re-entered the market. Home buyers in the GTA recognize that ownership housing is a quality long-term investment,” said Jason Mercer, TREB’s Director of Market Analysis.

If you’re thinking of making a move and would like to know how we can help, please contact us for more info.

June 2018 Market Stats: Infographic & Report

 
2018-07-06 - June Market Stats.jpg
 

June 2018 market stats are here!

The average sale price for the month was $807,871, up 2.0% compared to June 2017.

Here’s a breakdown of the average sale prices & year-over-year increases/decreases for the 416 area code:

  • Detached = $1,354,429 (-2.4%)

  • Semi-Detached = $999,754 (+1.4%)

  • Townhouse = $736,963 (+5.6%)

  • Condo Apartment = $605,530 (+9.5%)

And here’s TREB’s official market report for the month of June 2018:

Toronto Real Estate Board President Garry Bhaura, in his first market release as TREB President, is pleased to announce some positive signs with respect to the housing market.

Greater Toronto Area REALTORS® reported 8,082 home sales through TREB’s MLS® System in June 2018 – up 2.4 per cent compared to the low June 2017 result.

After preliminary seasonal adjustment, sales were also up 17.6 per cent on a monthly basis between May 2018 and June 2018, continuing the trend of somewhat volatile month-over-month changes over the past year as home buyers reacted to various policy changes impacting the market.

“Home ownership has proven to be a positive long-term investment. After some adjustment to the Fair Housing Plan, the new Office of The Superintendent of Financial Institutions (OSFI) stress test requirement and generally higher borrowing costs, home buyers are starting to move back into the market, with sales trending up from last year’s lows. Market conditions appear to be tightening, with sales accounting for a greater share of listings, as new listings have dropped compared to last year,” said Mr. Bhaura.

The average selling price edged up by two per cent on a year-over-year basis to $807,871 in June 2018.

After preliminary seasonal adjustment, the average selling price was also up by 3.3 per cent month-over-month between May 2018 and June 2018.

The MLS® Home Price Index (HPI) was down by 4.8 per cent on a year-over-year basis, but remained basically flat month-over-month.

The difference in the year-over-year rates of change between the average price and the MLS® HPI was likely due, at least in part, to a change in the mix of properties sold in June 2018 compared to June 2017, with low-rise home types accounting for a greater share of sales in June 2018.

“The expectation is to see improvement in sales over the next year. Over the same period, however, it is likely that issues surrounding the supply of listings will persist. This suggests that competition between buyers could increase, exerting increased upward pressure on home prices. With a new provincial government in place and municipal elections on the horizon, housing supply should be top-of-mind for policy makers,” said Jason Mercer, TREB’s Director of Market Analysis and Service Channels.

If you’re thinking of making a move and would like to know how we can help, please contact us for more info.

The Power Of A Firm Offer

Strong.jpg

In a seller’s market, where demand outweighs supply and properties often receive multiple offers, buyers need to do everything they can to give themselves the upper hand.

One of the most powerful ways to strengthen their position when competing with other buyers is to submit a firm offer-to-purchase.

Think about it - if you’re a seller with two offers in front of you and one of them is conditional upon the buyer arranging financing and the other one isn’t (all other things being equal), which one are you going to go with?

Accepting a firm offer means there’s no waiting period to suffer through with the possibility that the buyer will walk away from the deal.

A firm offer means you can go to bed that night knowing that you’re property is sold and it’s a done deal.

Peace-of-mind like this carries a lot of weight.

Keep in mind though; submitting a firm offer is not to be taken lightly.

Preparation is key and there’s work to be done ahead of time by the buyer, their realtor, their mortgage broker, and possibly their lawyer.

Financing Condition:

Obtaining a mortgage pre-approval is crucial, but it’s not worth much if your broker is surprised with significant details when the time comes to actually arrange the financing (eg. “I forgot to mention that I’ve got a $30,000 student loan I’m slowly chipping away at.”).

Be sure to provide accurate income and debt figures so that your pre-approval is solid and you can comfortably go in without this condition.

Home Inspection Condition:

If the sellers are "holding-back" on offers, get in there and have a home inspection done prior to the offer date.

Yes, it’s going to cost you approx $600.00 and you may not even end up getting the property.

But six hundred bucks is peanuts compared to the hundreds of thousands (or more!) you’ll be dropping on your home purchase.

Having the inspection done ahead of time will allow you to come to the table sans condition and give you a better shot at sealing the deal.

A number of sellers will actually have their own “pre-listing” home inspection done ahead of time and the results will be made available to all prospective buyers.

Status Certificate Condition (condominiums):

The best case scenario here is that the seller has already obtained a current Status Certificate and copies are made available to all prospective buyers for their lawyers to review prior to the offer date.

If the docs are not available ahead of time, the buyer and their realtor need to have a discussion about the risks of submitting a firm offer without seeing the Status Certificate.

There is some homework that the realtor can do to give their client some peace-of-mind in this area, but it needs to be clear that there are still risks involved and nothing can substitute for a lawyer's thorough review of the documents.

Succeeding as a buyer in a seller's market is hard work.

There's plenty of competition out there right now and you need to find every advantage you can.

Being able to submit a firm offer certainly tips the scales in your favour.

If you’re thinking of making a move and would like to know how we can help, please to contact us for more info.

May 2018 Market Stats: Infographic & Report

 
11.jpg
 

May 2018 market stats are here!

The average sale price for the month was $805,320, down 6.6% compared to May 2017.

Here’s a breakdown of the average sale prices & year-over-year increases/decreases for the 416 area code:

  • Detached = $1,426,094 (-5.6%)

  • Semi-Detached = $1,067,128 (+0.3%)

  • Townhouse = $741,296 (-0.1%)

  • Condo Apartment = $602,804 (+6.5%)

And here’s TREB’s official market report for the month of May 2018:

Greater Toronto Area REALTORS® reported 7,834 sales through TREB’s MLS® System in May 2018.

This result was down by 22.2 per cent compared to May 2017.

While the number of sales was down year-over-year, the annual rate of decline was less than reported in February, March and April, when sales were down by more than 30 per cent.

On a month-over-month basis, seasonally adjusted May sales were basically flat compared to April.

Supply of homes available for sale continued to be an issue.

New listings were down by 26.2 per cent.

The fact that new listings were down by more than sales in comparison to last year means that competition increased between buyers.

Recent polling conducted by Ipsos for TREB suggests that listing intentions are down markedly since the fall.

“Home ownership remains a sound long-term investment. Unfortunately, many home buyers are still finding it difficult find a home that meets their needs. In a recent Canadian Centre for Economic Analysis study undertaken for the Toronto Real Estate Board, it was found that many people are over-housed in Ontario, with over five million extra bedrooms. These people don’t list their homes for sale, because they feel there are no alternative housing types for them to move into. Policy makers need to focus more on the ‘missing middle’ – home types that bridge the gap between detached houses and condominium apartments,” said Mr. Syrianos.

The MLS® Home Price Index (HPI) Composite Benchmark was down by 5.4 per cent year-over- year.

The average selling price for all home types combined was down by 6.6 per cent to $805,320.

On a seasonally adjusted basis, the average selling price was up by 1.1 per cent compared to April 2018.

“Market conditions are becoming tighter in the Greater Toronto Area and this will provide support for home prices as we move through the second half of 2018 and into 2019. There are emerging indicators pointing toward increased competition between buyers, which generally leads to stronger price growth. In the City of Toronto, for example, average selling prices were at or above average listing prices for all major home types in May,” said Jason Mercer, TREB’s Director of Market Analysis.

If you’re thinking of making a move and would like to know how we can help, please contact us for more info.

April 2018 Market Stats: Infographic & Report

 
RLPS_Apr_Infographic_DT_Let_May3_2018.jpg
 

April 2018 market stats are here!

The average sale price for the month was $804,584, down 12.4% compared to April 2017.

Here’s a breakdown of the average sale prices & year-over-year increases/decreases for the 416 area code:

  • Detached = $1,354,719 (-14.3%)

  • Semi-Detached = $1,021,986 (-7.8%)

  • Townhouse = $792,180 (+.02%)

  • Condo Apartment = $601,211 (+3.8%)

And here’s TREB’s official market report for the month of April 2018:

Toronto Real Estate Board President Tim Syrianos announced that Greater Toronto Area REALTORS® reported 7,792 sales through TREB’s MLS® System in April 2018.

The average selling price was $804,584.

On a year-over-year basis, sales were down by 32.1 per cent and the average selling price was down by 12.4 per cent.

The year-over-year change in the overall average selling price has been impacted by both changes in market conditions as well as changes in the type and price point of homes being purchased.

This is especially clear at the higher end of the market.

Detached home sales for $2 million or more accounted for 5.5 per cent of total detached sales in April 2018, versus 10 per cent in April 2017.

The MLS® Home Price Index strips out the impact of changes in the mix of home sales from one year to the next.

This is why the MLS® HPI Composite Benchmark was down by only 5.2 per cent year-over-year versus 12.4 per cent for the average price.

“While average selling prices have not climbed back to last year’s record peak, April’s price level represents a substantial gain over the past decade. Recent polling conducted for TREB by Ipsos tells us that the great majority of buyers are purchasing a home within which to live. This means these buyers are treating home ownership as a long-term investment. A strong and diverse labour market and continued population growth based on immigration should continue to underpin long-term home price appreciation,” said Mr. Syrianos.

“The comparison of this year’s sales and price figures to last year’s record peak masks the fact that market conditions should support moderate increases in home prices as we move through the second half of the year, particularly for condominium apartments and higher density low-rise home types. Once we are past the current policy-based volatility, home owners should expect to see the resumption of a moderate and sustained pace of price growth in line with a strong local economy and steady population growth,” said Jason Mercer, TREB’s Director of Market Analysis.

If you’re thinking of making a move and would like to know how we can help, please contact us for more info.

Should I Buy First Or Should I Sell First? (Part II)

Timing.jpg

In a previous blog post (read it here) I explored some of the unique factors involved when selling one property and buying another at the same time.  I touched briefly on market conditions, budgetary concerns, and the best way to avoid being pressured into making a purchase you’re not completely happy with.  There's one more factor I'd like to take a look at - Timing.

Part of my job as a Realtor is to help clients time the closings of their purchases and sales as perfectly as possible.  If you're buying and selling at the same time, you'll ideally want to take possession of your new home a few days prior to giving up possession on your old one.  This way, you've got a few days' overlap with both properties.  This allows for a bit of breathing room with regards to booking movers, switching over telephone and internet connections, etc.

However, it's not always possible to line up the closings as closely as we'd like.  In anticipation of this possibility I ask my clients, "Would you rather have two homes for a few weeks or no home for a few weeks?"

Having two homes for a few weeks can be an issue as most buyers rely on the proceeds from the sale of one home to go towards the purchase of another.  Thankfully, bridge financing can help to "bridge" this gap.  Of course, bridge financing can only be obtained if there's a firm sale on the purchaser's property...

Having no home for a few weeks is obviously going to be much more of an issue for the majority of buyers.  Sure, there's the possibility of a short term rental during the interim.  But who wants to move everything into the rental and then turn around and move again shortly after?  I have seen people do it though - especially if their dream home comes along and they don't want to risk it passing them by.

If my clients and I anticipate that timing the closings may be an issue, I include a clause in the agreement that allows them the power to either move up or extend the closing date if they need to.  This doesn't always fly though - it depends largely on the other party's own particular situation and what kind of leverage position my clients are in. 

Ultimately, "Should I buy first or should I sell first?" is a question without an easy answer.  Each situation is different from the next and the same strategy isn't going to work for every buyer/seller.  Be sure to consult your realtor for advice on how best to proceed.

If you’re thinking of making a move and would like to know how we can help, please contact me for more info.

February 2018 Market Stats: Infographic & Report

 
TREB-Stats-February-2018.jpg
 

February 2018 market stats are here!

The average sale price for the month was $767,818, down 12.4% compared to February 2017.

Here’s a breakdown of the average sale prices & year-over-year increases/decreases for the 416 area code:

  • Detached = $1,282,240 (-18.6%)

  • Semi-Detached = $985,902 (-9.0%)

  • Townhouse = $776,642 (+15.5%)

  • Condo Apartment = $570,275 (+10.7%)

And here’s TREB’s official market report for the month of February 2018:

Toronto Real Estate Board President Tim Syrianos announced that Greater Toronto Area REALTORS® reported 5,175 residential transactions through TREB’s MLS® System in February 2018.

This result was down 34.9 percent compared to the record 7,955 sales reported in February 2017.

The number of new listings entered into TREB’s MLS® System totaled 10,520, a 7.3 per cent increase compared to the 9,801 new listings entered in February 2017.

However, the level of new listings remained below the average for the month of February for the previous 10 years.

“When TREB released its Outlook for 2018, the forecast anticipated a slow start to the year compared to the historically high sales count reported in the winter and early spring of 2017. Prospective home buyers are still coming to terms with the psychological impact of the Fair Housing Plan, and some have also had to reevaluate their plans due to the new OFSI-mandated mortgage stress test guidelines and generally higher borrowing costs,” said Mr. Syrianos.

The MLS® Home Price Index Composite Benchmark was up by 3.2 per cent on a year-over-year basis for the TREB market area as a whole.

This growth was driven by the apartment and townhouse market segments, with annual benchmark price increases of 18.8 per cent and 7.5 per cent respectively.

Single-family detached and attached benchmark prices were down slightly compared to February 2017.

The overall average selling price for February sales was down 12.4% year-over-year to $767,818.

However, putting aside the price spike reported in the first quarter of 2017, it is important to note that February’s average price remained 12 per cent higher than the average reported for February 2016, which represents an annualized increase well above the rate of inflation for the past two years.

“As we move further into the spring and summer months, growth in sales and selling prices is expected to pick up relative to last year. Expect stronger price growth to continue in the comparatively more affordable townhouse and condominium apartment segments. This being said, listings supply will likely remain below average in many neighbourhoods in the GTA, which, over the long-term, could further hamper affordability,” said Jason Mercer, TREB’s Director of Market Analysis.

If you’re thinking of making a move and would like to know how we can help, please contact us for more info.

Should I Buy First Or Should I Sell First?

question.jpg

As my career in real estate continues to grow (I’ll be entering my 13th year in the business next month), I find myself getting more and more repeat business from past clients.  Generally, this comes in the form of them wanting to sell the home I helped them buy a few years ago and move up to something bigger.  While this particular buying/selling scenario is not uncommon, it does have its own unique set of factors to keep in mind.  The easiest way to explore these is with the question, “Should I buy first or should I sell first?”

Buying First

When the time comes for someone to sell and move up, they usually have a pretty good idea of what they want in their new home.  More closets.  A powder room.  Some outdoor space.  Room for a home office.  The list goes on...  I can tell you from experience that my clients have an even more specific list of "must haves" the second or third time around.

Buying first is a great option as it allows you time to shop for the home you truly want as opposed to settling for whatever happens to be on the market at the time.  In the Toronto market inventory is often tight and it can sometimes take awhile for buyers to find and secure the right home.  The last thing you want is to be pressured into a purchase simply because the deadline on your own sale is approaching fast.  Buying first can give you more breathing room and peace of mind in this respect. 

Selling First

Selling first is a good option for some as it allows for a better idea of what their buying budget is.  What if your home sells for $50,000 more than you're expecting?  An extra 50K can certainly help check off more of the boxes on your buying wish list.  On the flip side, what if your home sell for $50,000 less than you're expecting?  No one wants to be in the position of having over spent on their purchase and coming up short on their sale.

Of course, when making any major real estate decision, current market conditions need to be considered.  In a balanced market, less weight would be given to this factor.  The reality though is that the Toronto real estate market is rarely balanced!  In a Seller's Market, buying first is generally going to be the safer option.  In a Buyer's Market, selling first will likely be the way to go. 

If you’re thinking of making a move and would like to know how we can help, please contact us for more info.

December 2017 Market Stats: Infographic & Report

 
December-2017-Stats.jpg
 

December 2017 market stats are here!

The average sale price for the month was $735,021, up 0.7% compared to December 2016.

Here’s a breakdown of the average sale prices & year-over-year increases/decreases for the 416 area code:

  • Detached = $1,250,235 (-2.8%)

  • Semi-Detached = $903,658 (+11.5%)

  • Townhouse = $649,294 (-2.4%)

  • Condo Apartment = $532,700 (+14.1%)

And here’s TREB’s official market report for the month of December 2017 (and an overview of the year in general):

Toronto Real Estate Board President Tim Syrianos announced that Greater Toronto Area REALTORS® reported 92,394 sales through TREB's MLS® System in 2017.

This total was down 18.3 per cent compared to the record set in 2016.

Record sales in Q1 were followed by a decline in Q2 and Q3 after the Ontario Fair Housing Plan (FHP) was announced.

The pace of sales picked up in Q4, as the impact of the FHP started to wane, and some buyers arguably brought forward their home purchase in response to the new OSFI stress test guidelines effective January 1, 2018.

"Much of the sales volatility in 2017 was brought about by government policy decisions. Research from TREB, the provincial government and Statistics Canada showed that foreign home buying was not a major driver of sales in the GTA. However, the Ontario Fair Housing Plan, which included a foreign buyer tax, had a marked psychological impact on the marketplace. Looking forward, government policy could continue to influence consumer behavior in 2018, as changes to federal mortgage lending guidelines come into effect," said Mr. Syrianos.

The average selling price for 2017 as a whole was $822,681 – up 12.7 per cent compared to 2016.

This annual growth was driven more so by extremely tight market conditions during the first four months of the year.

In the latter two-thirds of 2017, fewer sales combined with increased listings resulted in slower price growth.

In December, the MLS® Home Price Index (HPI) Composite Benchmark was up by 7.2 per cent year over year, and the overall average selling price was up by 0.7 per cent year over year.

"It is interesting to note that home price growth in the second half of 2017 differed substantially depending on market segment. The detached market segment – the most expensive on average – experienced the slowest pace of growth as many buyers looked to less expensive options. Conversely, the condominium apartment segment experienced double-digit growth, as condos accounted for a growing share of transactions," said Jason Mercer, TREB's Director of Market Analysis.

If you’re thinking of making a move and would like to know how we can help, please contact us for more info.

Our Real Estate Fave Of The Week: 3 Emerson Ave

1.jpg

Updated semi in Bloordale Village... for under a million!

This semi-detached 2.5-storey home has 4 bedrooms, 2 bathrooms, an updated kitchen and master bath.

What’s our favourite feature?

4 spacious bedrooms make this bright home big enough for a growing family. Plus it’s walking distance to all the amenities of up-and-coming Bloordale Village.

More Features:

  • Classic semi with brick exterior

  • Fireplace in living room

  • Bay window in dining room

  • Modern kitchen and master bath

  • Mudroom

  • Short walk to TTC

  • Parking for 2 cars

Price: $949,000

Taxes: $4,360/2017

Lot Size: 22 x 98 feet

Would you like a private tour of this home?  Give us a shout and we’ll make it happen!

Take a gander at all these gorgeous pics:

3.jpg
4.jpg
5.jpg
6.jpg
7.jpg
8.jpg
9.jpg
10.jpg
11.jpg
12.jpg
13.jpg
14.jpg
15.jpg
16.jpg
17.jpg

Listing Brokerage: Re/Max West Realty Inc.

November 2017 Market Stats: Infographic & Report

 
RLPS_Nov_Infographic_DT_Let_Dec5_2017.jpg
 

November 2017 market stats are here!

The average sale price for the month was $761,757, down 2.0% compared to November 2016.

Here’s a breakdown of the average sale prices & year-over-year increases/decreases for the 416 area code:

  • Detached = $1,276,184 (-5.1%)

  • Semi-Detached = $904,711 (-0.7%)

  • Townhouse = $760,501 (+12.3%)

  • Condo Apartment = $555,396 (+17.7%)

And here’s TREB’s official market report for the month November 2017:

Toronto Real Estate Board President Tim Syrianos announced that Greater Toronto Area REALTORS® reported 7,374 transactions through TREB's MLS® System in November 2017.

This result was up compared to October 2017, bucking the regular seasonal trend.

On a year-over-year basis, sales were down by 13.3 per cent compared to November 2016.

New listings entered into TREB's MLS® System in November 2017 amounted to 14,349 – up by 37.2 per cent compared to November 2016, when the supply of listings was very low from a historic perspective.

"We have seen an uptick in demand for ownership housing in the GTA this fall, over and above the regular seasonal trend. Similar to the Greater Vancouver experience, the impact of the Ontario Fair Housing Plan and particularly the foreign buyer tax may be starting to wane. On top of this, it is also possible that the upcoming changes to mortgage lending guidelines, which come into effect in January, have prompted some households to speed up their home buying decision," said Mr. Syrianos.

The MLS® Home Price Index (HPI) composite benchmark price was up by 8.4 per cent on a year-over-year basis in November 2017.

The average selling price for all home types combined was down by two per cent compared to November 2016, due in large part to a smaller share of detached home sales versus last year.

On a year-to-date basis, the average selling price was up by 13.4 per cent compared to the same period last year.

High density home types continued to lead the way in terms of price growth, with the average condominium apartment price up by double-digits compared to November 2016.

"Changes in market conditions have not been uniform across market segments. In line with insights from consumer polling undertaken by Ipsos in the spring, we are still seeing seller's market conditions for townhouses and condominium apartments in many neighbourhoods versus more balanced market conditions for detached and semi-detached houses. We will have more insights to share about consumer intentions for 2018 at the end of January when TREB releases its third annual Market Year in Review and Outlook report," said Jason Mercer, TREB's Director of Market Analysis.

If you’re thinking of making a move and would like to know how we can help, please contact us for more info.

Our Real Estate Fave Of The Week: 116 Bertmount Ave

1-2.jpg

In the heart of Leslieville lies 116 Bertmount Ave!

This semi-detached, 3-storey home has 4 + 1 bedrooms and 3 bathrooms. It's had many upgrades, including a totally renovated basement apartment.

What’s our favourite feature?

The cozy 3rd floor master, with its exposed brick, window seat, fireplace, and large french doors that open onto a private deck.

More Features:

  • Character filled home with classic brick exterior

  • Pretty leaded windows and living room fireplace

  • Large kitchen with stone counters and island

  • Income potential from basement unit

  • Parking for 1 car

  • Great neighbourhood

Price: $1,300,000

Taxes: $4,626.62/2017

Lot Size: 18.42 x 76.25 feet

Would you like a private tour of this home?  Give us a shout and we’ll make it happen!

Take a gander at all these gorgeous pics:

2-2.jpg
3-2.jpg
4-2.jpg
5-2.jpg
6-2.jpg
7-2.jpg
8-2.jpg
9-2.jpg
10-2.jpg
11-2.jpg
12-2.jpg
13-1.jpg
14-1.jpg
15-1.jpg
16-1.jpg
17-1.jpg
18-1.jpg
19-1.jpg
20-1.jpg

Listing Brokerage: Re/Max Hallmark Francis Group Realty

Who Actually Benefits From An Open House?

 
Open-House-Sign.jpg
 

There’s a misconception out there that open houses are not worth doing.

A lot of realtors think they're a waste of time. And a lot of sellers assume that the only people who come to open house are nosy neighbours and tire kickers.

Some people think that open houses do nothing more than benefit the listing agent, who uses them to try and capture new buyer leads.

In my opinion though, open houses are definiely worth doing and should be an important part of any home's marketing strategy.

In fact, an open house can potentially benefit all of the parties invloved in the buying/selling process.

How does the seller benefit?

The seller benefits from the added exposure the property gets. Open houses allow any number of potential buyers to view the property who were not able to book a private showing during the week. Yes, this includes nosy neighbors and tire kickers, but that's to be expected.

How does the buyer benefit?

The buyer benefits because it allows them added opportunities to get in to see the property. There are some buyers whose schedule does not allow them to book a showing with their realtor during the week, and open houses allow them a more relaxed time frame on the weekend to see the property.

Open houses are also great for buyers who have already seen the property with the realtor and want to come back for a second showing on the weekend. Perhaps bringing in family members, contractors, etc.

How does the buyer's realtor benefit?

The buyer's realtor benefits because it allows them to get their clients into the property if they are not available to show it themselves. Often times, buyers who are working with a realtor will still go out on their own and tour open houses on the weekends. They will then report back to their realtor if any of the houses are of interest and go from there.

How does the listing agent benefit?

The listing agent's most important job is to market the property and expose it to the highest number of potential buyers possible. Public open houses are an excellent way of doing this!

Yes, the listing agent might connect with some buyers at the open house who do not yet have a realtor (this is how I found the majority of my buyer clients when I first started in the industry). I'll be the first to admit that this side benefit no doubt strengthens a realtor's motivation to dedicate 3 - 4 hours of of their time on a Saturday or Sunday.

Still, the primary goal when a listing agent holds open houses is to expose the property and get it sold!

If you’re thinking of making a move and would like to know how we can help, please contact us for more info.

Our Real Estate Fave Of The Week: 1003 Queen St E #202

1-1.jpg

Lofty Living In Lesliville!

This lavish 2 bedroom, 2 bathroom loft boasts 10 foot ceilings, over 1,100 sq ft of space, and tasteful modern design. Want to bring the party outside? There’s a shared rooftop deck and garden with available BBQ hookup.

What are our favourite features?

The ceiling height, of course! And the large kitchen with pantry and cupboards galore (and did you see that gorgeous glass door refrigerator?!).

More Features:

  • Wide plank engineered hardwood flooring

  • Large windows and plenty of natural light

  • Only 8 units in the building

  • 10 foot ceilings

  • One owned parking space

  • Owned locker

  • Shared rooftop deck/garden, gym

Price: $799,900

Taxes: $5,081.45/2017

Maintenance: $757.75

Approx Sqft: 1,000 - 1,199

Would you like a private tour of this home?  Give us a shout and we’ll make it happen!

Take a gander at all these gorgeous pics:

2-1.jpg
3-1.jpg
4-1.jpg
5-1.jpg
6-1.jpg
7-1.jpg
8-1.jpg
9-1.jpg
10-1.jpg
11-1.jpg
12-1.jpg

Listing Brokerage: Re/Max Hallmark Realty LTD.

October 2017 Market Stats: Infographic & Report

 
RLPS_Oct_Infographic_DT_Let_Nov3_2017.jpg
 

October 2017 market stats are here!

The average sale price for the month was $780,104, up 2.3% over October 2016.

Here’s a breakdown of the average sale prices & year-over-year increases for the 416 area code:

  • Detached = $1,287,765 (-1.1%)

  • Semi-Detached = $948,309 (+5.2%)

  • Townhouse = $742,845 (+8.0%)

  • Condo Apartment = $555,004 (+20.9%)

And here’s TREB’s official market report for the month October 2017:

Toronto Real Estate Board President Tim Syrianos reported 7,118 residential sales through TREB's MLS® System in October 2017. This result represented an above-average increase between September and October of almost 12 per cent, pointing to stronger fall market conditions.

On a year-over-year basis, October sales were down compared to 9,715 transactions in September 2016. Total sales reported through the first 10 months of 2017 amounted to 80,198 – down from 99,233 for the same time period in 2016.

"Every year we generally see a jump in sales between September and October. However, this year that increase was more pronounced than usual compared to the previous ten years. So, while the number of transactions was still down relative to last year's record pace, it certainly does appear that sales momentum is picking up," said Mr. Syrianos.

The MLS® Home Price Index Composite benchmark price was up by 9.7 per cent on a year-over-year basis in October.

Annual rates of price growth were strongest for townhouses and condominium apartments.

The average selling price for October transactions was $780,104 – up by 2.3 per cent compared to the average of $762,691 in October 2016.

"The housing market in the GTA has been impacted by a number of policy changes at the provincial and federal levels. Similar to the track followed in the Greater Vancouver Area, it appears that the psychological impact of the Fair Housing Plan, including the tax on foreign buyers, is starting to unwind," said Jason Mercer, TREB's Director of Market Analysis.

If you’re thinking of making a move and would like to know how we can help, please contact us for more info.