October 2022 Market Stats


October 2022 market stats are here!

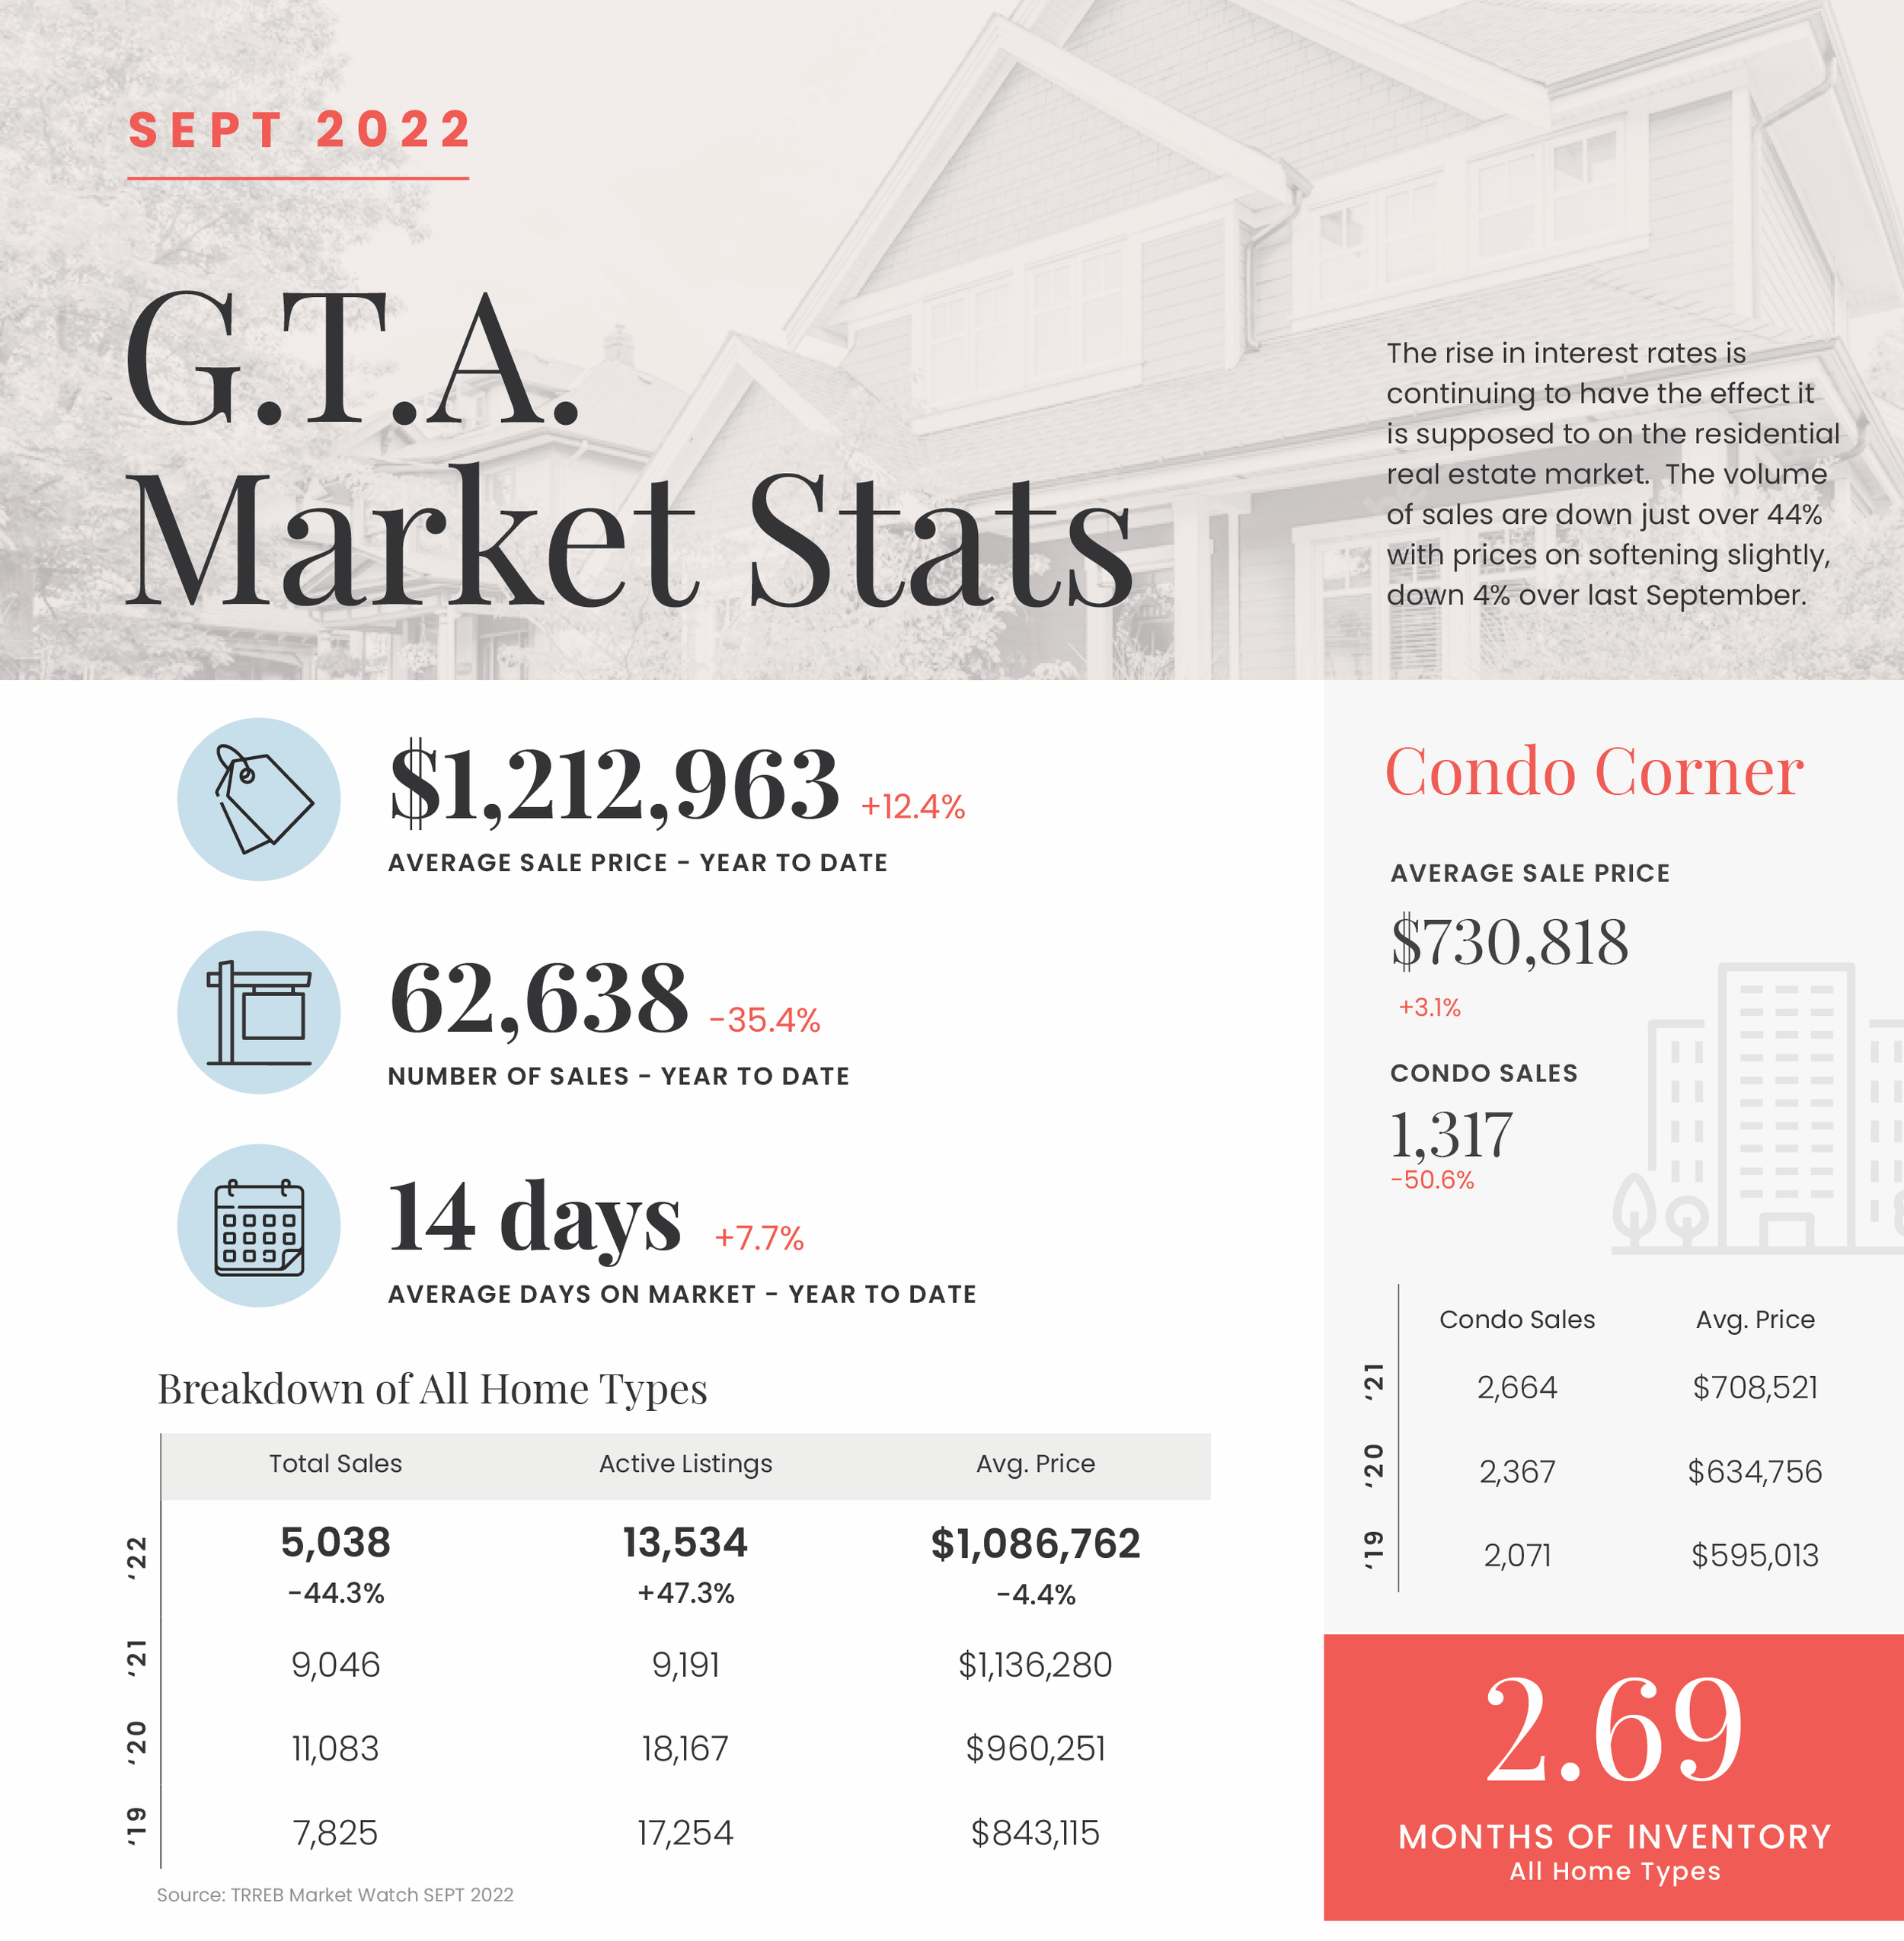
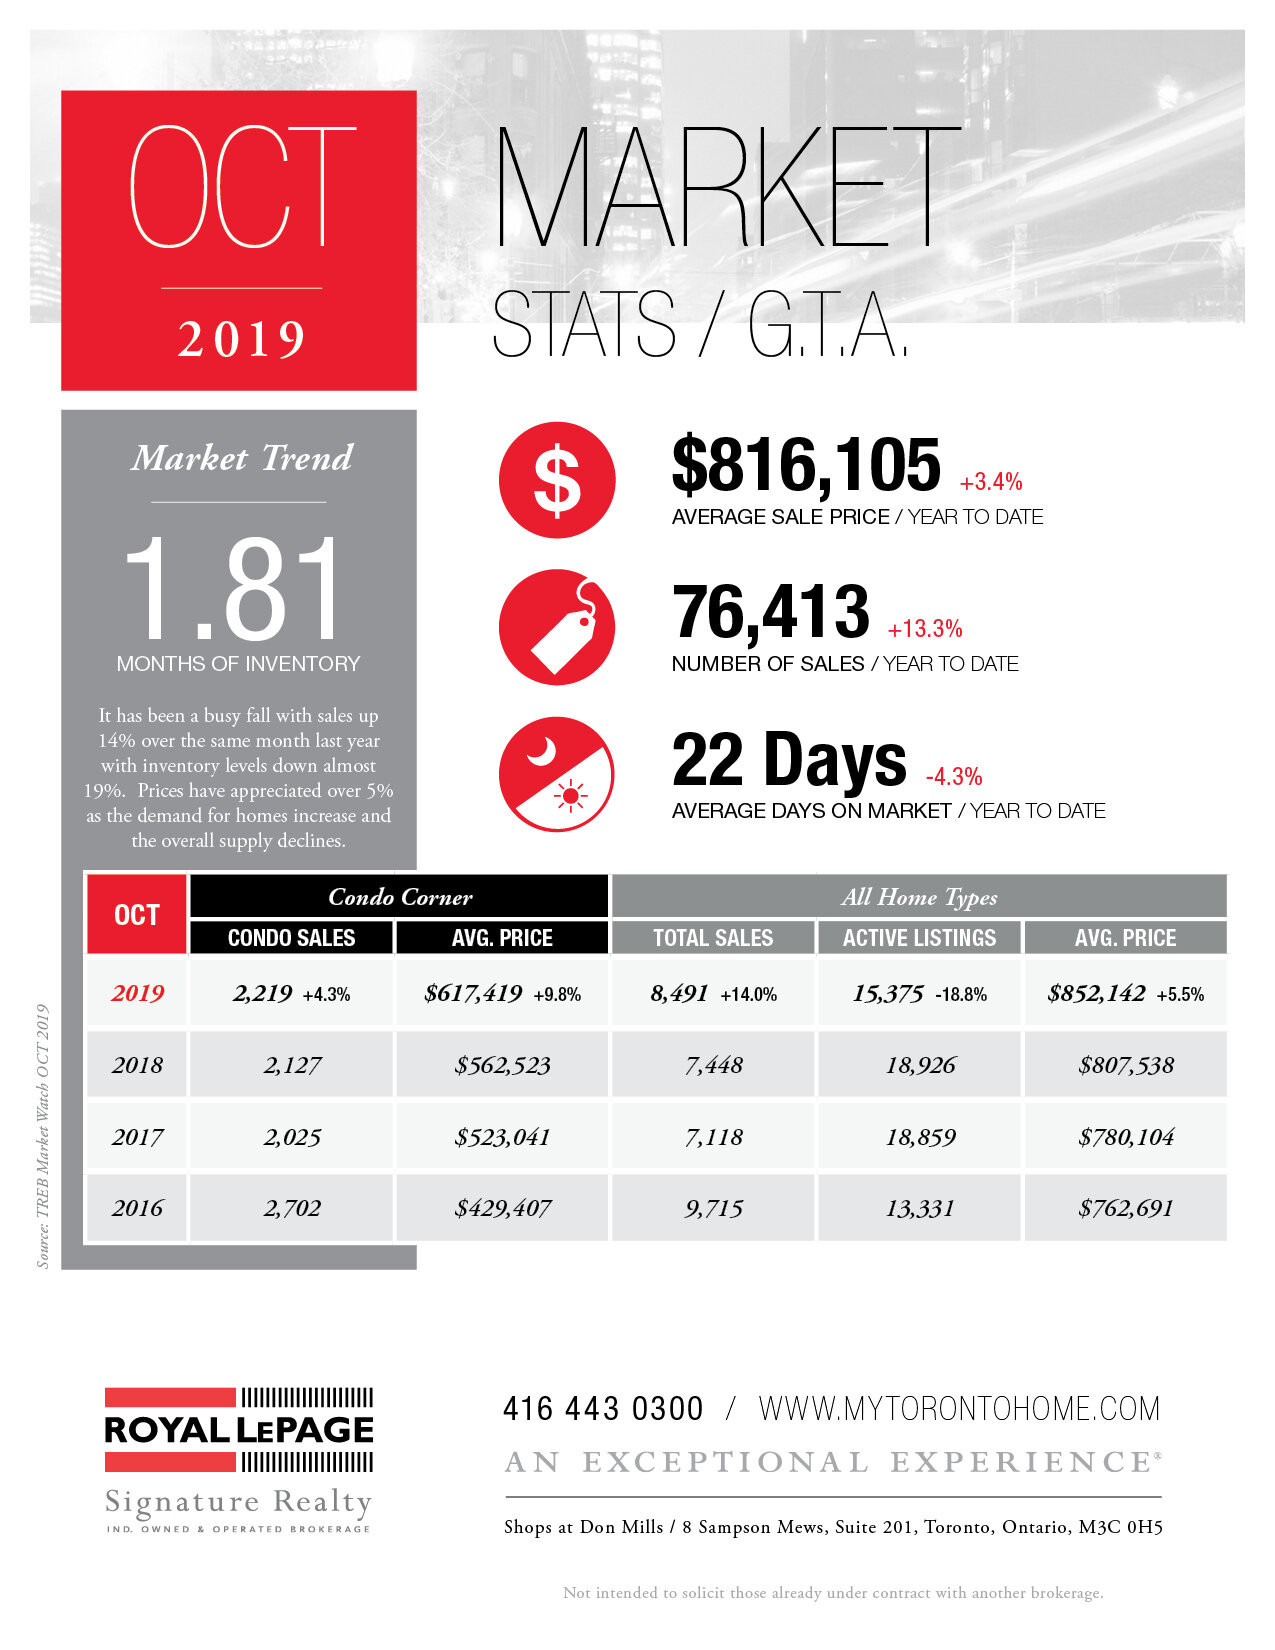
The residential real estate market continues to adjust and prices seem to have hit a consistent threshold where the average sale price of all home types in October is almost equal to September's average price ($1,089,428 and $1,086,762 respectively). 

The active number of listings has seen the greatest change, up 68% compared to the same month last year.  At the end of October there were over 13,000 homes available for sale, there were only 7,750 at this same time last year.

Another figure we watch is the number of monthly sales, down just over 49%.  Last October there were exactly 9,783 homes sold, this October there were 4,961.  With rising interest rates, fewer homes are being sold and inventory levels have begun to rise, putting downward pressure on prices, down almost 6% compared to October last year. 

No one likes to see the value of their home depreciate, however, the positive outlook in situations like this is that the months of available homes for sale continue to remain low with only 2.63 month of available inventory.  If another home, of any type, was not to come up for sale the GTA would be sold out of residential real estate in under three months.  A city the size of ours needs a lot of inventory to really see a major shift in prices as we simply do not have the inventory of available homes to currently do that.

Condominium sales continue to remain constant, appreciating 2% compared to October of last year.  Even with the volume of trades down almost 60% for this home type, condominiums continue to be an affordable way to own real estate in this great city.

If you’re thinking of making a move and would like to know how we can help, please contact us for more info.

September 2022 Market Stats: Infographics & Report


September 2022 market stats are here!

With the arrival of the Fall season, there have been some changes to the Greater Toronto Area's residential real estate market. The most dramatic changes have occurred to the volume of sales, there have been 44% fewer trades this September compared to last September. However, the average price of all home types is only down 4% compared to the same time period.

Prices have begun to adjust but not as drastically as one may have thought in relation to the rise of mortgage rates. Inventory levels increased by 47% compared to last September, up to a total of 13,534. Historically speaking this number is still not enough to cool the continued interest in real estate.

With annual immigration numbers being between 400,000 to 500,000 per year for the foreseeable future, the supply of homes will continue to be limited.

The rental market has continued to be very busy. With borrowing costs increasing more buyers have chosen to sit on the sidelines in hopes to wait out the rate increases or to see if prices will continue to adjust down.

With continued limits on the amount of homes for sale and strong immigration numbers, pricing will continue to adjust slowly or stay flat compared to previous years as the market gets used to the new interest rate environment.

If you’re thinking of making a move and would like to know how we can help, please contact us for more info.

How Much Can You Expect To Pay In Land Transfer Taxes?

taxes.jpg

Deposits, home inspections, legal fees...  

Whenever we start working with a buyer we go though the list of closing costs that they need to budget for.

One of the biggies is land transfer taxes.

Unless you live in Alberta, Saskatchewan, or rural Nova Scotia, land transfer taxes (or “property purchase taxes”) are a basic fact of life.  

These taxes, levied on properties that are changing hands, are the responsibility of the purchaser.

Many provinces have multi-tiered taxation systems that can prove complicated.  

In Ontario the tax is calculated on the value of the consideration at the following rates:

  • amounts up to and including $55,000: 0.5%

  • amounts exceeding $55,000, up to and including $250,000: 1.0%

  • amounts exceeding $250,000, up to and including $400,000: 1.5%

  • amounts exceeding $400,000: 2.0%

  • amounts exceeding $2,000,000, where the land contains one or two single family residences: 2.5%.

On a $1,000,000 purchase, for example, the Ontario land transfer tax would be $16,475.

Purchasing in Toronto?

If you're purchasing a property in the city of Toronto, you'll need to factor in an additional land transfer tax.

On that same $1,000,000 purchase, you're looking at an additional $16,475, bringing your total land transfer taxes to $32,950.

This isn't chump change.

Are you a first time buyer?

First-time buyers of new and re-sale homes are eligible to receive rebates on the provincial and Toronto land transfer taxes.

The maximum provincial land transfer tax rebate for first-time buyers is $4,000 and the maximum Toronto transfer tax rebate for first time buyers is $4,725.  

Check out the Ontario Ministry of Finance’s website (here) and the City of Toronto’s website (here) for a more detailed breakdown of these rebates and whether or not you're eligible to receive them.

And for access to a land transfer tax calculator visit ratehub.ca here.

If you’re thinking of making a move and would like to know how we can help, feel free to contact us for more info.

Sellers: Should You Have A Pre-Listing Home Inspection Done?

Home-Inspect-1.jpg

Before listing a house for sale, we always advise our seller clients to have a pre-listing home inspection done (and we pay for it).

In our experience it's best for everyone involved (the sellers, the buyers, and the realtors) to know the condition of the home before an offer is presented.

Any reasonable buyer is going to make their offer conditional on having a home inspection anyway, so why not nip potential problems in the bud?

If we're holding back offers on the property, then having a pre-listing home inspection is even more essential.

Sure, buyers who are planning on participating on offer night have the option of getting their own pre-offer home inspection done.

But not everyone is keen on spending $500 and a few hours of their time on a property that they might not even end up getting.

I've seen plenty of buyers decide to “sit this one out” and not participate on offer night because there was no pre-listing home inspection available.

Although there are plenty of home inspection companies in the city of Toronto, Carson Dunlop & Associates Ltd. is the go-to choice for many and they do a pretty good job of explaining the pre-listing home inspection themselves...

Following is an excerpt from the "Home Seller's Inspection" page on Carson Dunlop & Associates' website:

Why A Pre-Listing Home Inspection Makes So Much Sense:

With a traditional buyer’s (or pre-purchase) inspection, the buyer and seller negotiate the terms of the sale and agree on price. The sale is conditional on a home inspection. At the inspection the buyer finds out what condition the home is in. It sounds a little backwards already, doesn’t it? Why would you buy something before you know what shape it’s in?

The buyer gets the report, finds out the home is not perfect (none are) and feels they have overpaid. They want to re-negotiate, or worse, they want out of the transaction. The real estate sales professionals are in an awkward spot, because they have already sold the home, going through a tough negotiation. Now they have to tell the seller that the buyer wants a lower price. The sales process has to start over again, or the deal falls apart. Neither side is happy.

When the condition of the home is disclosed before the inspection, there are no surprises. It’s as simple as that.

Why is it not always done this way? Because of the way home inspection has grown. When there were no home inspections, this was not an issue. When home inspection was in its infancy, sellers hoped that buyers would not ask for an inspection. But now, virtually all buyers want an inspection. The game has changed. Sellers now understand that there will be an inspection, and it may well cause a problem. Rather than sit by and desperately hope for the best, sellers can control the situation.

Benefits of a Pre-Listing Inspection:

  1. Everyone knows the condition of the home, and there are no 11th hour surprises.

  2. No home is perfect and a good inspection report will provide that perspective.

  3. If there are issues raised that need a second opinion or further evaluation, that can happen before the house is listed, rather than in the middle of a high stress negotiation.

  4. Sellers can make improvements or reflect the condition in the listing price. (We prefer the latter.)

  5. Buyers are more comfortable making an offer, because they know what they are getting.

  6. In competitive situations, prospective buyers may not make an offer because they are not able to get an inspection, or the odds are high that the money spent on an inspection will be wasted. A seller’s inspection may allow more potential buyers to make an offer.

In today’s environment, with buyers getting home inspections, the seller is very wise to have the inspection done before the house goes on the market.

If you’re thinking of making a move and would like to know how I can help, feel free to contact us or more info.

June 2020 Market Stats: Infographics & Report


June 2020 market stats are here!

The average sale price in the GTA for the month was $930,869, up 11.9% compared to June 2019.

Here’s a breakdown of the June 2020 average sale prices & year-over-year increases/decreases for the 416 area code:

  • Detached = $1,523,770 (+14.3%)

  • Semi-Detached = $1,287,832 (+22.0%)

  • Townhouse = $855,339 (+6.2%)

  • Condo Apartment = $672,465 (+5.6%)

And here’s TREB’s official market report for the month of June 2020:

Toronto Regional Real Estate Board President Lisa Patel announced that Greater Toronto Area REALTORS® reported 8,701 sales through TRREB’s MLS® System in June 2020.

This result represented a very substantial increase over the May 2020 sales result, both on an actual (+89 per cent) and seasonally adjusted basis (+84 per cent), and was only down by 1.4 per cent compared to June 2019.

Year-over-year growth in sales was reported in some areas and market segments.

Especially notable were the detached and townhouse market segments in the GTA regions surrounding the City of Toronto.

New listings were up slightly on a year-over-year basis by 2.1 per cent.

However, active listings on TRREB’s MLS® System at the end of June 2020 were down by 28.8 per cent compared to June 2019.

Growth in new listings will need to outstrip growth in sales for a number of months before active listings approach last year’s levels.

The MLS® Home Price Index Composite Benchmark was up by 8.2 per cent year-over-year in June.

The average selling price for all home types combined was $930,869 – up by 11.9 per cent compared to June 2019.

The actual and seasonally-adjusted average selling price was also up substantially compared to May 2020, by 7.8 per cent and 9.8 per cent respectively.

Average and benchmark selling prices were up year-over-year for all major home types.

The strongest average annual rates of price growth were experienced in the detached and semi-detached market segments in the City of Toronto at 14.3 per cent and 22 per cent respectively.

This, coupled with the fact that average selling price growth outstripped growth in the MLS® HPI benchmarks, points to a resurgence in the higher-end market segments.

If you’re thinking of making a move and would like to know how we can help, please contact us or more info.

The Appeal Of A Condo Townhouse

Condo-Townhouse.jpg

With the province’s state of emergency and the resulting stay-at-home orders we’ve had to adhere to these past few months, it’s safe to say that the idea of “high rise living” has lost a bit of its sheen for some people.

We figured this would be a good time to revisit a past blog post of ours and take a look at why a condo townhouse might be a better option for some people.

Enjoy!

Your Own Front Door

Coming home to a high rise can sometimes be a daunting task (have you seen the elevator lobby of a 40 storey building at 5:30pm?). 

Residents essentially share their front door with everyone else in the building. 

Coming home to a townhouse is something quite different. 

There are no elevator line ups, no bustling front lobbies,... 

Instead, you walk a few steps up from the street, open your front door, and you’re home. 

Condo townhouses are much closer to freehold houses in this respect.

Multi-Level Layout

Many people like the idea of having an upstairs and a downstairs, which is tough to find when you’re looking at condo properties. 

There are 2-storey lofts that give you more than one level of living space (we’re thinking of 255 Richmond St E, 800 King St W, 954 King St W, and 1029 King St W, to name a few). 

However, the upper level in these suites is typically open to the floor below. 

Quite different than the upstairs/downstairs you’d find in a house. 

In a multi-level townhouse on the other hand, there’s a greater separation of space, one that just isn’t the same in a 2-storey loft or a comparably sized one-level suite. 

Outdoor Space

While many high rise suites do have balconies, it’s hard to compete with what a typical townhouse has to offer - your own private rooftop terrace! 

And it’s not just the extra square footage that makes these terraces so appealing, it’s also how the space is laid out. 

A typical high rise balcony is long and narrow, whereas a townhouse terrace is more square, allowing for a full patio furniture set, a barbecue, flower pots,...  

It’s also worth noting that a comparably sized terrace in a high rise is usually considered a premium feature and the price often reflects this. 

Of course, there will always be those who prefer high rise living. 

Townhouses aren't for everyone. 

But for those who are seeking something a bit quieter, something a bit more private, and something closer to a freehold house (without all of the maintenance), condo townhouses are an excellent alternative.

If you’re thinking of making a move and would like to know how we can help, feel free to contact us for more info.

February 2020 Market Stats: Infographics & Report

 
FEB - GTA.jpg

FEB - TORONTO.jpg
 

February 2020 market stats are here!

The average sale price in the GTA for the month was $910,290, up 16.7% compared to February 2019.

Here’s a breakdown of the February 2020 average sale prices & year-over-year increases/decreases for the 416 area code:

  • Detached = $1,485,304 (+14.4%)

  • Semi-Detached = $1,208,073 (+10.6%)

  • Townhouse = $846,465 (+10.5%)

  • Condo Apartment = $722,675 (+18.0%)

And here’s TREB’s official market report for the month of February 2020:

In line with the forecast contained in the Toronto Regional Real Estate Board’s recently released Market Year in Review and Outlook Report, TRREB President Michael Collins announced a very strong year-over-year sales and price growth in February 2020.

Greater Toronto Area REALTORS® reported 7,256 residential transactions through TRREB’s MLS® System in February 2020, representing a 45.6 per cent increase compared to a 10-year sales low in February 2019.

However, February 2020 sales were still below the 2017 record result.

Year-over-year sales growth, for the GTA as a whole, was strongest for ground-oriented home types.

After preliminary seasonal adjustment, February 2020 sales also exhibited positive momentum, up by 14.8 per cent compared to January 2020.

New listings amounted to 10,613 in February 2020, a 7.9 per cent increase compared to February 2019.

This moderate annual growth rate was much smaller than that reported for sales, which means market conditions tightened considerably over the past year.

As market conditions tightened over the past year, competition between buyers has clearly increased.

This resulted in a further acceleration in year-over-year price growth in February.

The MLS® Home Price Index Composite Benchmark was up by 10.2 per cent.

The average selling price for all home types combined was up by 16.7 per cent to $910,290.

Double-digit average price growth was experienced for most major market segments, including detached houses and condominium apartments.

If you’re thinking of making a move and would like to know how we can help, please contact us or more info.

Quick Breakdown: The New Mortgage Stress-Test

 
2020-02-26 - Mortgage Stress Test.jpg
 

Last week, the federal government announced some upcoming changes to the way it calculates qualifying interest rates when implementing the mortgage stress test.

These change will take effect on April 6, 2020.

Before the change, the stress test is based on the interest rates posted by the 6 major banks (more specifically, the government looks at the Big 6 Banks’ posted 5-year fixed rates and then adds 2% on top of that number).

After the change, the test will be based on the interest rates posted by the mortgage industry (more specifically, the government will look at the weekly median 5-year fixed insured mortgage rate from mortgage insurance applications, and then add 2% on top of that number).

Essentially, the change will make sure the stress test is dictated by what’s actually happening in the market, as opposed to what the banks dictate. And the stress test will be more dynamic, since it'll be based on the weekly numbers.

The Government of Canada’s press release from February 18th states, “This follows a recent review by federal financial agencies which concluded that the minimum qualifying rate should be more dynamic to better reflect the evolution of market conditions. Overall, the review concluded that mortgage standards are working to ensure that home buyers are able to afford their homes even if interest rates rise, incomes change, or families are faced with unforeseen expenses. This adjustment to the stress test will allow it to be more representative of the mortgage rates offered by lenders and more responsive to market conditions."

While the change so far applies to insured mortgages, it’s expected to apply to uninsured mortgages as well. The February press release states, "The Office of the Superintendent of Financial Institutions (OSFI) also announced today that it is considering the same new benchmark rate to determine the minimum qualifying rate for uninsured mortgages. OSFI is seeking input from interested stakeholders on this proposal before March 17, 2020."

Insured Mortgages: When a borrower has less than a 20% down payment, lenders are required to obtain government-backed mortgage insurance. The mortgages must comply with the insured mortgage rules set by the Minister of Finance, including the insured minimum qualifying rate.

Uninsured Mortgages: When the borrower has a down payment of 20%, or more, of the sale price, insurance is not required. The minimum qualifying rate for uninsured mortgages is set by OSFI, the independent banking regulator.

So, what do the changes mean for the average borrower?

From what we're hearing, it’ll likely amount to a 2% - 3% increase in purchasing power.

For example, a budget of $800,000 under the current rules might increase to $815,000 - $825,000 under the new rules.

This might not sound like much, but any little bit helps in a tight market like Toronto’s.

If you have any questions just give us a shout and we’ll put you in touch with a mortgage specialist who can help.

January 2020 Market Stats: Infographic & Report

 
GTA.jpg

Toronto.jpg
 

January 2020 market stats are here!

The average sale price for the month was $839,363, up 12.3% compared to January 2019.

Here’s a breakdown of the January 2020 average sale prices & year-over-year increases/decreases for the 416 area code:

  • Detached = $1,369,848 (+16.7%)

  • Semi-Detached = $1,004,208 (+1.1%)

  • Townhouse = $782,274 (-1.9%)

  • Condo Apartment = $679,182 (+15.0%)

And here’s TREB’s official market report for the month of January 2020:

TRREB President Michael Collins announced that Greater Toronto Area REALTORS® reported 4,581 home sales through TRREB’s MLS® System in January 2020 – up by 15.4 per cent compared to January 2019.

On a preliminary seasonally adjusted basis, sales were up by 4.8 per cent compared to December 2019.

“We started 2020 where 2019 left off, with very strong growth in the number of sales up against a continued dip in the number of new and available listings. Tighter market conditions compared to a year ago resulted in much stronger growth in average selling prices. Steady population growth, low unemployment and low borrowing costs continued to underpin substantial competition between buyers in all major market segments,” said Mr. Collins.

The MLS® HPI Composite Benchmark price was up by 8.7 per cent compared to January 2019 – the highest annual rate of growth for the Benchmark since October 2017.

The condominium apartment market segment continued to lead the way in terms of MLS HPI® price growth, but all home types experienced price growth above seven per cent when considering the TRREB market area as a whole.

The average selling price in January was up by 12.3 per cent, driven by the detached and condominium apartment segments in the City of Toronto.

“A key difference in the price growth story in January 2020 compared to January 2019 was in the low-rise market segments, particularly with regard to detached houses. A year seems to have made a big difference. It is clear that many buyers who were on the sidelines due to the OSFI stress test are moving back into the market, driving very strong year-over-year sales growth in the detached segment. Strong sales up against a constrained supply continues to result in an accelerating rate of price growth,” said Jason Mercer, TRREB’s Director of Market Analysis and Service Channels.

If you’re thinking of making a move and would like to know how we can help, please contact us or more info.

Would You Buy A Home Near The Tracks?

Close-to-Train-Tracks.jpg

Every buyer has a list of must-haves and deal-breakers when they start their home search.

As the search progresses, this list often changes.

Things that were initially important become less so when a buyer sees how little supply there is in the Toronto real estate market.

A few examples?

  • Having a powder room on the main floor.

  • Having a 4th bedroom on the 2nd floor.

  • Having a private driveway.

Don't get me wrong, none of the above items are impossible to find in a house in Toronto.

Depending on location though, any one of them might be very tough to come by.

Plain and simple: a Toronto home buyer needs to be willing to compromise at least a bit on their list of must-haves and deal-breakers.

One thing that often stays on the list though, is avoiding houses that are close to the train tracks.

This is such a negative in some buyers’ minds, that it's not even up for discussion.

Anytime a new listing pops up that might work for one of our clients, we bring up the address on Google maps and check the house's specific location.

Too close to the tracks? Our clients might want to skip it.

Not every buyer has a clear-cut objection to being close to the tracks though.

Sometimes, if the house is only close-ish to the tracks, then it's okay.

Of course, every buyer's definition of close-ish is subjective!

A few years ago we worked with some buyers who were shopping for a home in The Junction.

There's a pocket there, north of Dundas St. W, that sits just south of the train tracks. It contains streets like Quebec Ave, Clendenan Ave, and a handful of others.

A house popped up for sale there, only about 10 houses from the tracks. Certainly close enough to hear the train while sitting in the backyard or from inside the house when the windows are open.

Not close enough to deter our clients from considering it though.

Evidently, the tracks weren't an issue for a handful of other buyers either...

The house sold on offer-night, for a sale price well above list. In fact, it set a new record for that type of house in that area.

Another house popped up in that pocket a few weeks later, roughly the same distance from the tracks. This house broke the record price set by the previous house!

So, it's clear that being close to tracks isn't a deal-breaker for everyone.

What about a house that backs directly onto the tracks?

No doubt, this is a tough sell for most buyers. And if we had clients that were considering it, we’d certainly caution them about the resale-ability of the property.

For some buyers though, it offers the opportunity to finally get a home in a very competitive market. Their willingness to look at a house that backs onto the tracks opens up possibilities that other buyers won't consider.

What about you? Would you consider buying a house near the tracks?

If you're thinking of making a move and would like to know how we can help, please contact us for more info.

Is January Too Early To Start Looking For A Home?

Worm2.jpg

I'll let you in on a secret... the spring real estate market actually starts in January.

Well, not officially. And certainly not in full swing (that doesn't happen until March/April).

The early beginnings of the spring market do start in January though.

I was out with a new client yesterday and he asked a question that I often get this time of year, "Is it too early to start looking for a place?  It's only January... Am I better to wait until the spring?"

My answer was simple: "Not if the right property comes along".

Sure, you could wait another month or two.  There'll likely be more listings to choose from in late-February/March. The flip-side is that there'll likely be more buyers in the market then as well. More supply, but also more competition.

Getting out there and actively looking in January means getting a jump on the rest of the market.

What if things start to heat up in March and prices start to increase? Buying in January could mean paying less than what the same property is going to cost you in the spring.

And then there are the properties that've been sitting on the market all through December with no action. You may be able to benefit from a seller whose time is running out and needs to sell.

Of course, the right property might not come along until the spring. Even then, you can still chalk your January efforts up to "getting familiar with market". None of it is time wasted if it leads to you making a confident, informed purchase.

What are you waiting for? The early worm catches the bird!

If you’re thinking of making a move and would like to know how we can help, feel free to contact us for more info.

December 2019 Market Stats: Infographic & Report

 
1 - RLPS_Infographic_Stats_Let_Jan8_2020_01_GTA (1).jpg

RLPS_Infographic_Stats_Let_Dec4_2019_02_TORONTO.jpg
 

December 2019 market stats are here!

The average sale price for the month was $837,788, up 11.9% compared to December 2018.

Here’s a breakdown of the December 2019 average sale prices & year-over-year increases/decreases for the 416 area code:

  • Detached = $1,363,357 (+19.5%)

  • Semi-Detached = $1,004,477 (+6.9%)

  • Townhouse = $717,369 (+0.4%)

  • Condo Apartment = $656,233 (+10.3%)

And here’s TREB’s official market report for the month of December 2019:

Toronto Real Estate Board President Michael Collins reported that December 2019 residential sales reported through TREB’s MLS® System by Greater Toronto Area REALTORS® were up by 17.4 per cent year-over-year to 4,399.

Total sales for calendar year 2019 amounted to 87,825 – up by 12.6 per cent compared to the decade low 78,015 sales reported in 2018.

On an annual basis, 2019 sales were in line with the median annual sales result for the past decade.

“We certainly saw a recovery in sales activity in 2019, particularly in the second half of the year. As anticipated, many home buyers who were initially on the sidelines moved back into the market place starting in the spring. Buyer confidence was buoyed by a strong regional economy and declining contract mortgage rates over the course of the year,” said Mr. Collins.

While sales were up in 2019, the number of new listings entered into TREB’s MLS® System was down by 2.4 per cent year-over-year.

For the past decade, annual new listings have been largely in a holding pattern between 150,000 and 160,000, despite the upward trend in home prices over the same period.

“Over the last ten years, TREB has been drawing attention to the housing supply issue in the GTA. Increasingly, policy makers, research groups of varying scope and other interested parties have acknowledged that the lack of a diverse supply of ownership and rental housing continues to hamper housing affordability in the GTA. Taking 2019 as an example, we experienced a strong sales increase up against a decline in supply. Tighter market conditions translated into accelerating price growth. Expect further acceleration in 2020 if there is no relief on the supply front,” said Jason Mercer, TREB’s Chief Market Analyst.

The MLS® Home Price Index Composite Benchmark was up by 7.3 per cent on a year-over-year basis in December 2019.

From June 2019 onward, the annual growth rate in the MLS® HPI Composite Benchmark accelerated.

The average selling price in December 2019 was $837,788 – up almost 12 per cent year-over-year.

For calendar year 2019, the average selling price was $819,319 – up by four per cent compared to $787,856 in 2018.

If you’re thinking of making a move and would like to know how we can help, please contact us or more info.

Who Lists Their Home For Sale In Late-December?

123451.jpg

Who lists their home for sale in late-December?

People who have to sell, that’s who.

Otherwise they’d wait until the 2nd week in January, which is when the spring market starts and an influx of buyers begin (or resume) their hunt.

Sure, there are still some buyers out there looking in late December.

Not many though.

And the ones that are looking are likely doing so half-assed, as they’re distracted with holiday obligations, etc.

Sellers in the Toronto real estate market don’t always have a choice though, when it comes to timing the sale of their home.

Sometimes, listing in late-December is their only option.

For example, let’s say you make a purchase at the end of November, with a 60 day closing.

The good news here is that you go into the holiday season knowing that you’ve bought a house, and the stress of searching for a home is off your plate.

But now you’ve got a home to sell, just as the market is about to slow down!

Some of you are thinking, “Well, don’t buy a home at the end of November then! Make your purchase in September or October instead.”

The reality is that buying a home in the Toronto real estate market can be tough; there’s a tonne of competition when it comes to good houses and if an opportunity presents itself you have to jump on it, whether or not it’s actually the best time of year to make a move.

This isn’t necessarily a bad thing though.

If you have a great house in a great neighbourhood, and you’re able to get your act together quickly enough to list within that first week of December, then you’re likely going to be okay.

You might actually benefit from the fact that there won’t be many other listings to compete with, and you’ll appeal to those buyers who are seriously looking to lock down a purchase before the holiday season starts.

When To Wait

If it’s going to take a couple of weeks of prep time to get your home ready, then you need to consider putting off listing until the new year.

Or if you’ve got the kind of property that might take a little longer to sell (it ain’t the purdiest house on the block, and/or it’s in a less-than-desirable neighbourhood), you might want to avoid sitting on the market during the holiday season.

A house like this is going to look staler than last year’s fruit cake by the time mid-January rolls around (zing!).

Not everyone has the stress tolerance to wait though.

Going back to the example above, if the home you purchased is closing on February 1st, then waiting until the new year to list only allows you a couple of weeks to get yourself a firm sale (this is assuming that bridge financing is going to be an option).

A tight deadline like this is too stressful for some sellers, and they decide to swallow the risks of listing in late-December.

Either way, there are pros and cons to each option that a seller has to accept.

Our advice is to work with a realtor who has guided clients through this process before.

You need someone in your corner who has a handle on all the angles, especially at a time of year when there's so much else to stress about!

Happy Holidays!

If you're thinking of selling your home, and you want an agent who knows when the best time to list is, feel free to contact us for more info.

November 2019 Market Stats: Infographic & Report

 
RLPS_Infographic_Stats_Let_Dec4_2019_01_GTA.jpg

RLPS_Infographic_Stats_Let_Dec4_2019_02_TORONTO.jpg
 

November 2019 market stats are here!

The average sale price for the month was $843,637, up 7.1% compared to November 2018.

Here’s a breakdown of the average sale prices & year-over-year increases/decreases for the 416 area code:

  • Detached = $1,360,246 (+4.9%)

  • Semi-Detached = $1,067,027 (+0.3%)

  • Townhouse = $763,298 (+3.2%)

  • Condo Apartment = $659,855 (+10.9%)

And here’s TREB’s official market report for the month of November 2019:

Toronto Real Estate Board President Michael Collins announced that Greater Toronto Area REALTORS® reported 7,090 sales through TREB's MLS® System in November 2019 – a 14.2 per cent increase compared to November 2018.

On a GTA-wide basis, sales were up year-over-year for all major market segments.

Annual sales growth in ground oriented home types, including detached houses, led the way. 

New listings entered into TREB's MLS® System in November and the active listings count at the end of the month went in the opposite direction compared to last year, with new listings down 17.9 per cent year-over-year and active listings down 27.2 per cent. 

"An increasing number of home buyers impacted by demand-side policies over the past three years, including the 2017 Ontario Fair Housing Plan and the OSFI mortgage stress test, have moved back into the market for ownership housing. Based on affordability and stricter mortgage qualification standards, many buyers may have likely adjusted their preferences, changing the type and/or location of home they ultimately chose to purchase," said Mr. Collins. 

As market conditions continued to tighten in November 2019, with increased sales up against an increasingly constrained supply of listings, the annual rate of price growth continued to accelerate.

The MLS® Home Price Index Composite Benchmark increased by 6.8 per cent year-over-year.

The average selling price increased by 7.1 per cent year-over-year to $843,637. Both the MLS® HPI and the average selling price for the TREB market area as a whole experienced the strongest annual rates of price growth for the year in November. 

"Strong population growth in the GTA coupled with declining negotiated mortgage rates resulted in sales accounting for a greater share of listings in November and throughout the second half of 2019. Increased competition between buyers has resulted in an acceleration in price growth. Expect the rate of price growth to increase further if we see no relief on the listings supply front," said Jason Mercer, TREB's Chief Market Analyst.

If you’re thinking of making a move and would like to know how we can help, please contact us or more info.

October 2019 Market Stats: Infographic & Report

 
Unknown.jpeg

Unknown-1.jpeg
 

October 2019 market stats are here!

The average sale price for the month was $852,142, up 5.5% compared to October 2018.

Here’s a breakdown of the average sale prices & year-over-year increases/decreases for the 416 area code:

  • Detached = $1,323,015 (+1.1%)

  • Semi-Detached = $1,099,802 (+7.1%)

  • Townhouse = $795,115 (+3.5%)

  • Condo Apartment = $662,631 (+9.6%)

And here’s TREB’s official market report for the month of October 2019:

Toronto Real Estate Board President Michael Collins announced that Greater Toronto Area REALTORS® reported 8,491 residential sales through TREB’s MLS® System in October 2019.

This result represented a 14 per cent increase compared to 7,448 sales reported in October 2018.

GTA-wide, sales were up on a year-over-year basis for all major home types.

“A strong regional economy obviously fuels population growth. All of these new households need a place to live and many have the goal of purchasing a home. The problem is that the supply of available listings is actually dropping, resulting in tighter market conditions and accelerating price growth,” said Mr. Collins.

The trend of annual growth in sales versus annual decline in new listings continued in October 2019, with new listings down by 9.6 per cent compared to October 2018.

The resulting tighter market conditions compared to a year ago resulted in positive annual rates of price growth across all major market segments, from a GTA-wide perspective.

The MLS® Home Price Index Composite Benchmark was up by 5.8 per cent on a year-over-year basis in October 2019 – the strongest annual rate of growth since December 2017.

The average selling price for all home types combined was up by 5.5 per cent to $852,142, compared to $807,538 in October 2018.

“As market conditions in the GTA have steadily tightened throughout 2019, we have seen an acceleration in the annual rate of price growth. While the current pace of price growth remains moderate, we will likely see stronger price growth moving forward if sales growth continues to outpace listings growth, leading to more competition between home buyers,” said Jason Mercer, TREB’s Chief Market Analyst.

If you’re thinking of making a move and would like to know how we can help, please contact us or more info.

Condo Kitchens Ain't What They Used To Be

Kitchen.jpg

They don’t make 'em like they used to.

This adage certainly applies when it comes to the kitchens in many newer condos.

For some reason, it’s now the norm to step into a newer condo and find the kitchen sitting open against one wall. No wrap-around counter top. Not much in the way of cupboard space. And not at all what buyers would've accepted a few years ago.

How did this happen?

Well, it falls in line with the continuing trend towards smaller and smaller spaces. Having the kitchen sit open against one wall allows developers to squeeze “more” into less square footage. And less square footage per unit means more units per building which, in turn, translates into more profit for the developer.

Fair enough, but it’s the residents who are getting the short end of the stick here.

Take a look at the floor plan below and you'll see what I'm talking about.

The kitchen occupies a relatively small stretch of space along the far right wall. There is a small bit of counter space on either side of the sink, but barely enough for a microwave, toaster oven, or coffee maker. Of course you could add a floating breakfast bar, but that's going to eat into some of the floor space needed to pass from the entrance way to the bedroom and/or living/dining room. And then where the heck do you put a dining room table?

Floorplan-Bad-Kitchen.jpg

Now here's an example of a much better kitchen. This is a classic one-bedroom floor plan. You can see that the kitchen here offers plenty of counter space and there's certainly enough room for a (small) dining table in addition to the living room set-up.

Floorplan-Good-Kitchen.gif

It is interesting to note that both of these floor plans are pretty close to one another in terms of actual square footage. Both sit within that 500 - 525 sq ft range. It's how they use the square footage that makes the difference.

Granted, the first layout has a few disadvantages from the get-go. Most notably the fact that a chunk of space in the upper-left-hand corner is cut-out. This is probably to accommodate the elevator shaft. Or maybe even part of the suite next door.

Regardless, the kitchen in the first layout is very representative of what you'll see in many newer condos. And it's too bad.

It's frustrating for me as a realtor because I get clients who want all the finishes, features, bells, and whistles of a new condo... and a kick-ass kitchen to boot. The reality is that the two don't always go hand-in-hand. Often, getting the "classic" kitchen layout means purchasing a suite that's a bit less than brand-new.

It's a compromise. But then again, when isn't compromise part of the equation in buying a piece of Toronto real estate?

If you’re thinking of making a move and would like to know how we can help, feel free to contact us for more info.

September 2019 Market Stats: Infographic & Report

 
September 2019 - GTA.jpg

September 2019 - Toronto.jpg
 

September 2019 market stats are here!

The average sale price for the month was $843,115, up 5.8% compared to September 2018.

Here’s a breakdown of the average sale prices & year-over-year increases/decreases for the 416 area code:

  • Detached = $1,360,623 (+1.2%)

  • Semi-Detached = $1,069,119 (+7.0%)

  • Townhouse = $785,890 (+5.7%)

  • Condo Apartment = $636,817 (+3.3%)

And here’s TREB’s official market report for the month of September 2019:

Toronto Real Estate Board President Michael Collins announced that Greater Toronto Area REALTORS® reported 7,825 sales through TREB’s MLS® System in September 2019.

This result represented strong year-over-year sales growth of 22 per cent compared to 6,414 sales reported in September 2018.

It is important to note, however, that sales remain well-below the record September 2016 peak of more than 9,800 sales.

On a preliminary seasonally adjusted basis, the September 2019 sales level remained in virtually the same as the August 2019 result.

The supply of listings continued to be a concern in September 2019, with new listings down by 1.9 per cent year-over-year to 15,611.

We have experienced multiple months this year wherein the annual rate of sales growth outpaced the annual rate of new listings growth, resulting in the overall number of active listings at month-end being well-below last year’s levels.

This speaks to tightening market conditions and an accelerating annual rate of price growth.

The annual rate of price growth in September reached the highest point so far in 2019.

The MLS® Home Price Index (HPI) Composite Benchmark was up by 5.2 per cent on a year-over-year basis in September.

The average selling price for all home types combined was up by a similar annual rate of 5.8 per cent to $843,115.

On a preliminary seasonally adjusted basis, the September 2019 average selling price was up by 1.2 per cent compared to August 2019.

If you’re thinking of making a move and would like to know how we can help, please contact us or more info.

Wooly Bully Offer!

 
Wooly_bully.png
 

Bully offers have always been a part of the Toronto real estate market. Over the last few years though, they've become much more commonplace than ever before.

They've became so prevalent in fact, that almost every listing with a scheduled offer-date now includes the following note, "The seller reserves the right to consider preemptive offers".

(Yes, bully offers are now often being referred to as "preemptive offers". Us realtors are capable of putting a positive spin on any negative, and we're apparently trying to class-up the term a bit.)

It used to be, a listing would hit the market on a Tuesday or Wednesday with a scheduled offer-date for the following week, and the sellers would wait until then to review any offers.

This would give everyone plenty of time to see the home and do their due diligence before submitting an offer.

Buyers would have time to crunch their numbers and work with their mortgage person to get the financing in order, they'd have time to take a look at the pre-listing home inspection (or do their own inspection), and they'd be able sleep on it all for a few days before deciding whether or not to participate on offer-night.

Times have changed.

We're at a point now where sellers cannot bank on the fact that a home will still be available for sale come offer-night.

The new reality is that buyers have to be prepared to go and see a listing within just a few hours of it hitting the market, and potentially submit an offer that night!

And of course it goes without saying that their offer has to be a damn good one. No conditions, a significant deposit, and a price well-above asking.

This is just the way it is now; the whole concept of "offer-night" in the Toronto real estate market has been disrupted.

Our advice: move quickly to view a property you’re interested in… there’s no telling how long it’ll stick around.


If you're thinking of making a move and want an agent who's able move quickly and help you submit a competitive bully offer, feel free to contact us for more info.

August 2019 Market Stats: Infographic & Report

 
August 2019 - GTA.jpg

August 2019 - Toronto.jpg
 

August 2019 market stats are here!

The average sale price for the month was $792,611,755, up 3.6% compared to August 2018.

Here’s a breakdown of the average sale prices & year-over-year increases/decreases for the 416 area code:

  • Detached = $1,246,392 (+0.3%)

  • Semi-Detached = $956,411 (+7.3%)

  • Townhouse = $712,934 (+4.1%)

  • Condo Apartment = $619,307 (+5.7%)

And here’s TREB’s official market report for the month of August 2019:

Toronto Real Estate Board President Michael Collins announced that Greater Toronto Area REALTORS® reported 7,711 residential sales through TREB’s MLS® System in August 2019.

This result represented a 13.4 per cent increase compared to 6,797 sales reported in August 2018.

On a month- over-month basis, after preliminary seasonal adjustment, sales were up by 0.8 per cent.

GTA-wide sales were up on a year-over-year basis for all major market segments, with annual rates of sales growth strongest for low-rise home types including detached houses.

This reflects the fact that demand for more expensive home types was very low in 2018 and has rebounded to a certain degree in 2019, albeit not back to the record levels experienced in 2016 and the first quarter of 2017.

Market conditions also became tighter in August 2019 compared to a year ago because, while sales were up year-over-year, new listings were down by three per cent over the same time period to 11,789. Year-to-date, growth in sales has well outstripped growth in new listings.

This is why overall active listings counted at the end of August were down by more than 11 per cent compared to August 2018.

The MLS® Home Price Index Composite Benchmark for August 2019 was up by 4.9 per cent on a year-over-year basis.

The average selling price, at $792,611 in August 2019, was up by 3.6 per cent year-over-year.

Both the MLS® HPI benchmark prices and average selling prices were up on an annual basis for major market segments.

The condominium apartment segment continued to lead the way in terms of price growth, followed by higher density low-rise home types and finally detached houses.

If you’re thinking of making a move and would like to know how we can help, please contact us or more info.

Will A King Size Bed Fit In Here?

Will A King Size Bed Fit In Here? Photo

Will A King Size Bed Fit In Here? Photo

Wants. Needs. Every buyer's got 'em.

Sometimes wants & needs align nicely and a buyer finds a property that ticks all of their boxes. Sometimes they don't.

I was out with a client earlier this week, looking at condos near Yonge & Lakeshore. We stepped into the 2nd bedroom of the first condo and she asked, "Do you think a king size bed could fit in here?"

A king size bed... in a condo's 2nd bedroom!

If you've seen even a handful of condos in the downtown core you know that the 2nd bedrooms are usually pretty tight. You'd be lucky to squeeze a queen size into many of them, let alone a king!

"How important is that?" I asked.  "Is it a want... Or is it a need?"

In this case, it was a need. Each buyer has their own set of "must-haves" and for her, being able to fit a king size bed into the 2nd bedroom was on the list.

Fortunately, the condos we were seeing were on the larger side and the 2nd bedrooms weren't too bad. A few of them were actually large enough to fit a king. Of course, there wouldn't be any room left for end tables, armoires, or much else. That didn't matter to her though. The fact that a king could fit was enough.

Point being, each and every buyer is going to have their own set of criteria when searching for a home. Sure, the majority of items on that list are going to be the same for almost everyone (granite counter tops, stainless steel appliances, hardwood floors, etc...).

Sometimes though, something unique finds its way onto the short-list and I'm given fodder for a new blog post...

If you’re thinking of making a move and would like to know how I can help, feel free to contact me for more info.