If you haven't already heard, the Canadian Department of Finance made an announcement earlier this month outlining a handful of changes that will have an impact on the mortgage/housing market.
The Globe & Mail followed the announcement pretty quickly with a detailed breakdown of all the changes, and how the affects might be felt.
Below is a reposting of that article in full. Enjoy!
From the Globe & Mail, on October 3rd, 2016:
Four Major Changes To Canada's Housing Rules
The Liberal government has announced sweeping changes aimed at ensuring Canadians aren’t taking on bigger mortgages than they can afford in an era of historically low interest rates.
The changes are also meant to address concerns related to foreign buyers who buy and flip Canadian homes.
Below is a breakdown of the four major changes Finance Minister Bill Morneau announced Monday.
The current rules
Buyers with a down payment of at least 5 per cent of the purchase price but less than 20 per cent must be backed by mortgage insurance. This protects the lender in the event that the home buyer defaults. These loans are known as “high loan-to-value” or “high ratio” mortgages.
In situations in which the buyer has 20 per cent or more for a down payment, the lender or borrower could obtain “low-ratio” insurance that covers 100 per cent of the loan in the event of a default.
Mortgage insurance in Canada is backed by the federal government through the Canada Mortgage and Housing Corp. Insurance is sold by the CMHC and two private insurers, Genworth Financial Mortgage Insurance Company Canada and Canada Guaranty Mortgage Insurance Company. The federal government backs the insurance offered by the two private-sector firms, subject to a 10-per-cent deductible.
------
The change
Expanding a mortgage rate stress test to all insured mortgages.
What it is
As of Oct. 17, a stress test used for approving high-ratio mortgages will be applied to all new insured mortgages – including those where the buyer has more than 20 per cent for a down payment. The stress test is aimed at assuring the lender that the home buyer could still afford the mortgage if interest rates were to rise. The home buyer would need to qualify for a loan at the negotiated rate in the mortgage contract, but also at the Bank of Canada’s five-year fixed posted mortgage rate, which is an average of the posted rates of the big six banks in Canada. This rate is usually higher than what buyers can negotiate. As of Sept. 28, the posted rate was 4.64 per cent.
Other aspects of the stress test require that the home buyer will be spending no more than 39 per cent of income on home-carrying costs like mortgage payments, heat and taxes. Another measure called total debt service includes all other debt payments and the TDS ratio must not exceed 44 per cent.
Who it affects
This measure affects home buyers who have at least 20 per cent for a down payment but are seeking a mortgage that may stretch them too thin if interest rates were to rise. It also affects lenders seeking to buy government-backed insurance for low-ratio mortgages.
Why
The government is responding to concerns that sharp rises in house prices in cities like Toronto and Vancouver could increase the risk of defaults in the future should mortgage rates rise.
------
The change
As of Nov. 30, the government will impose new restrictions on when it will provide insurance for low-ratio mortgages.
What it is
The new rules restrict insurance for these types of mortgages based on new criteria, including that the amortization period must be 25 years or less, the purchase price is less than $1-million, the buyer has a credit score of 600 and the property will be owner-occupied.
Who it affects
This measure appears to be aimed at lowering the government’s exposure to residential mortgages for properties worth $1-million or more, a category of the market that has increased sharply in recent years in Vancouver and Toronto.
Why
Vancouver and Toronto are the two real estate markets that are of most concern for policy makers at all levels of government. These measures appear to be targeted at those markets.
------
The change
New reporting rules for the primary residence capital gains exemption.
What it is
Currently, any financial gain from selling your primary residence is tax-free and does not have to be reported as income. As of this tax year, the capital gains tax is still waived, but the sale of the primary residence must be reported at tax time to the Canada Revenue Agency.
Who it affects
Everyone who sells their primary residence will have a new obligation to report the sale to the CRA, however the change is aimed at preventing foreign buyers who buy and sell homes from claiming a primary residence tax exemption for which they are not entitled.
Why
While officials say more data are needed, Ottawa is responding to extensive anecdotal evidence and media reports showing foreign investors are flipping homes in Canada and falsely claiming the primary residence exemption.
------
The change
The government is launching consultations on lender risk sharing.
What it is
Currently, the federal government is on the hook to cover the cost of 100 per cent of an insured mortgage in the event of a default. The federal government says this is “unique” internationally and that it will be releasing a public consultation paper shortly on a proposal to have lenders, such as banks, take on some of that risk. The Department of Finance Canada acknowledges this would be “a significant structural change to Canada’s housing finance system.”
Who it affects
Mortgage lenders, such as banks, would have to take on added risk. This could potentially lead to higher mortgage rates for home buyers.
Why
The federal government wants to limit its financial obligations in the event of widespread mortgage defaults. It also wants to encourage prudent lending practices.
------
Five previous federal housing moves since 2008
Monday’s package of announcements is the sixth time since the onset of the 2008 financial crisis that Ottawa has taken policy action in response to concerns about Canada’s housing market.
July, 2008: After briefly allowing the CMHC to insure high-ratio mortgages with a 40-year amortization period, then Conservative finance minister Jim Flaherty moved to tighten those rules by reducing the maximum length of an insured high-ratio mortgage to 35 years.
February, 2010: Responding to concern that some Canadians were borrowing too much against the rising value of their homes, the government lowered the maximum amount Canadians could borrow in refinancing their mortgages to 90 per cent of a home’s value, down from 95 per cent. The move also set a new 20-per-cent down payment requirement for government-backed mortgage insurance on properties purchased for speculation by an owner who does not live in the property.
January, 2011: The Conservative government under Stephen Harper tightened the rules further, dropping the maximum amortization period for a high-ratio insured mortgage to 30 years. The maximum amount Canadians could borrow via refinancing was further lowered to 85 per cent.
June, 2012: A third round of tightening brought the maximum amortization period down to 25 years for high-ratio insured mortgages. A new stress test was also introduced to ensure that debt costs are no more than 44 per cent of income for lenders seeking a high-ratio mortgage. Refinancing rules were also tightened for a third time, setting a new maximum loan of 80 per cent of a property’s value. Another new measure limited the availability of government-backed insured high-ratio mortgages to homes valued at less than $1-million.
December, 2015: The recently elected Liberal government moved to tighten lending rules for homes worth more than $500,000, saying it was focused on “pockets of risk” in the housing sector.
The package of measures included doubling the minimum down payment for insured high-ratio mortgages to 10 per cent from 5 per cent for the portion of a home’s value from $500,000 to $1-million.
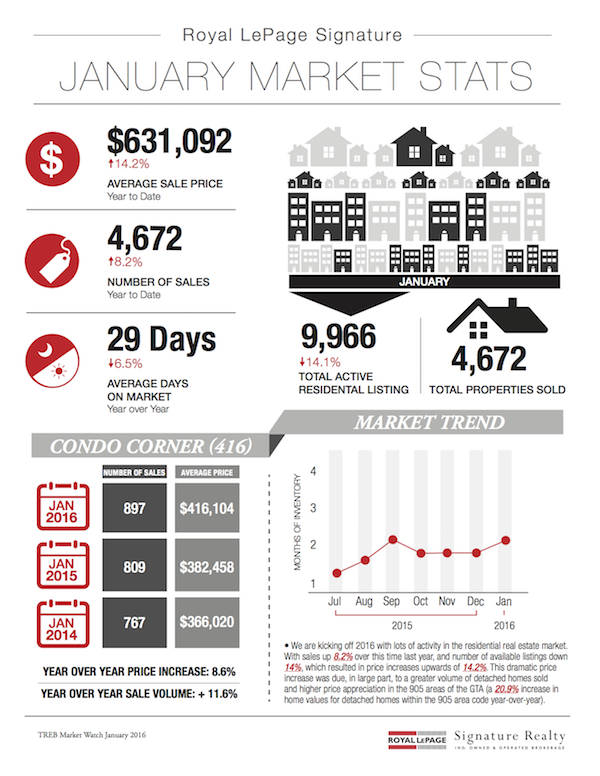
 Following is TREB’s market report for the year 2016:
 Following is TREB’s market report for October 2016:
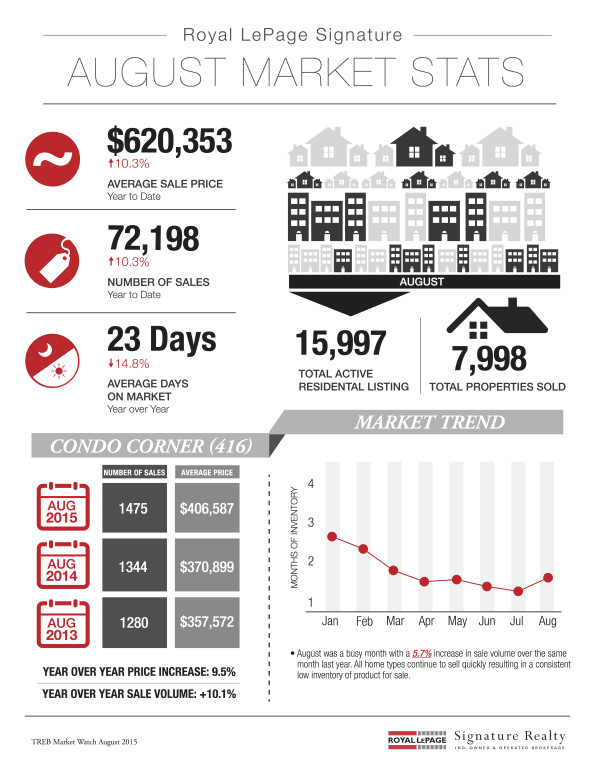
 Following is TREB’s market report for August 2016:
 Following is TREB’s market report for June 2016:
 Back in April, MPAC started mailing out their 2016 property assessment notices to property owners across the province of Ontario. If you don’t have yours yet - keep checking the mail; they should all be out by the fall.
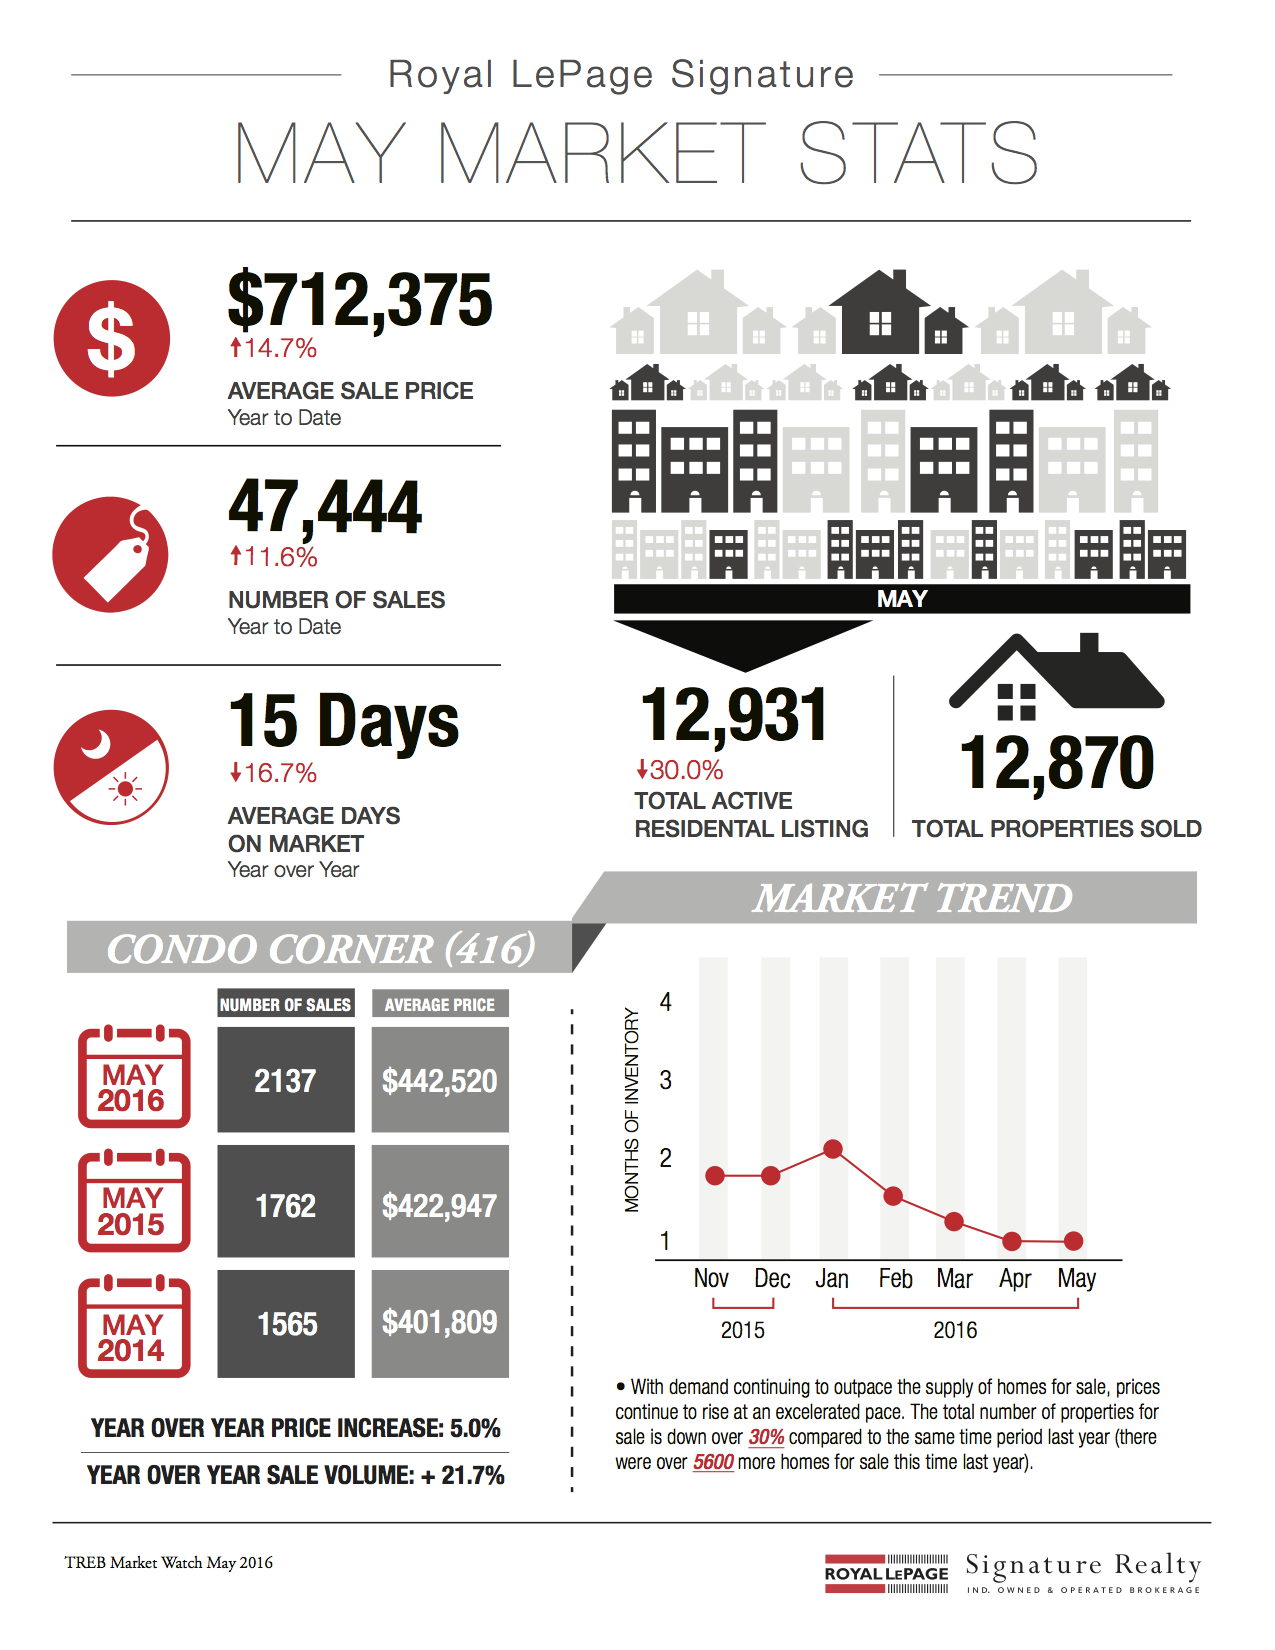 Following is TREB’s market report for May 2016:
 Following is TREB’s market report for April 2016:
 More than once over the course of these past few months, I've seen a house come on the market and sell for significantly more than what it was unsuccessfully listed at back in the fall/winter.

 Following is TREB's market report for November 2015:

 Following is TREB's market report for September 2015: