August 2018 Market Stats: Infographic & Report

 
2018-09-06 - August Market Stats.jpg
 

August 2018 market stats are here!

The average sale price for the month was $765,270, up 4.7% compared to August 2017.

Here’s a breakdown of the average sale prices & year-over-year increases/decreases for the 416 area code:

  • Detached = $1,244,275 (+4.9%)

  • Semi-Detached = $891,208 (-0.5%)

  • Townhouse = $683,160 (-0.1%)

  • Condo Apartment = $585,355 (+8.3%)

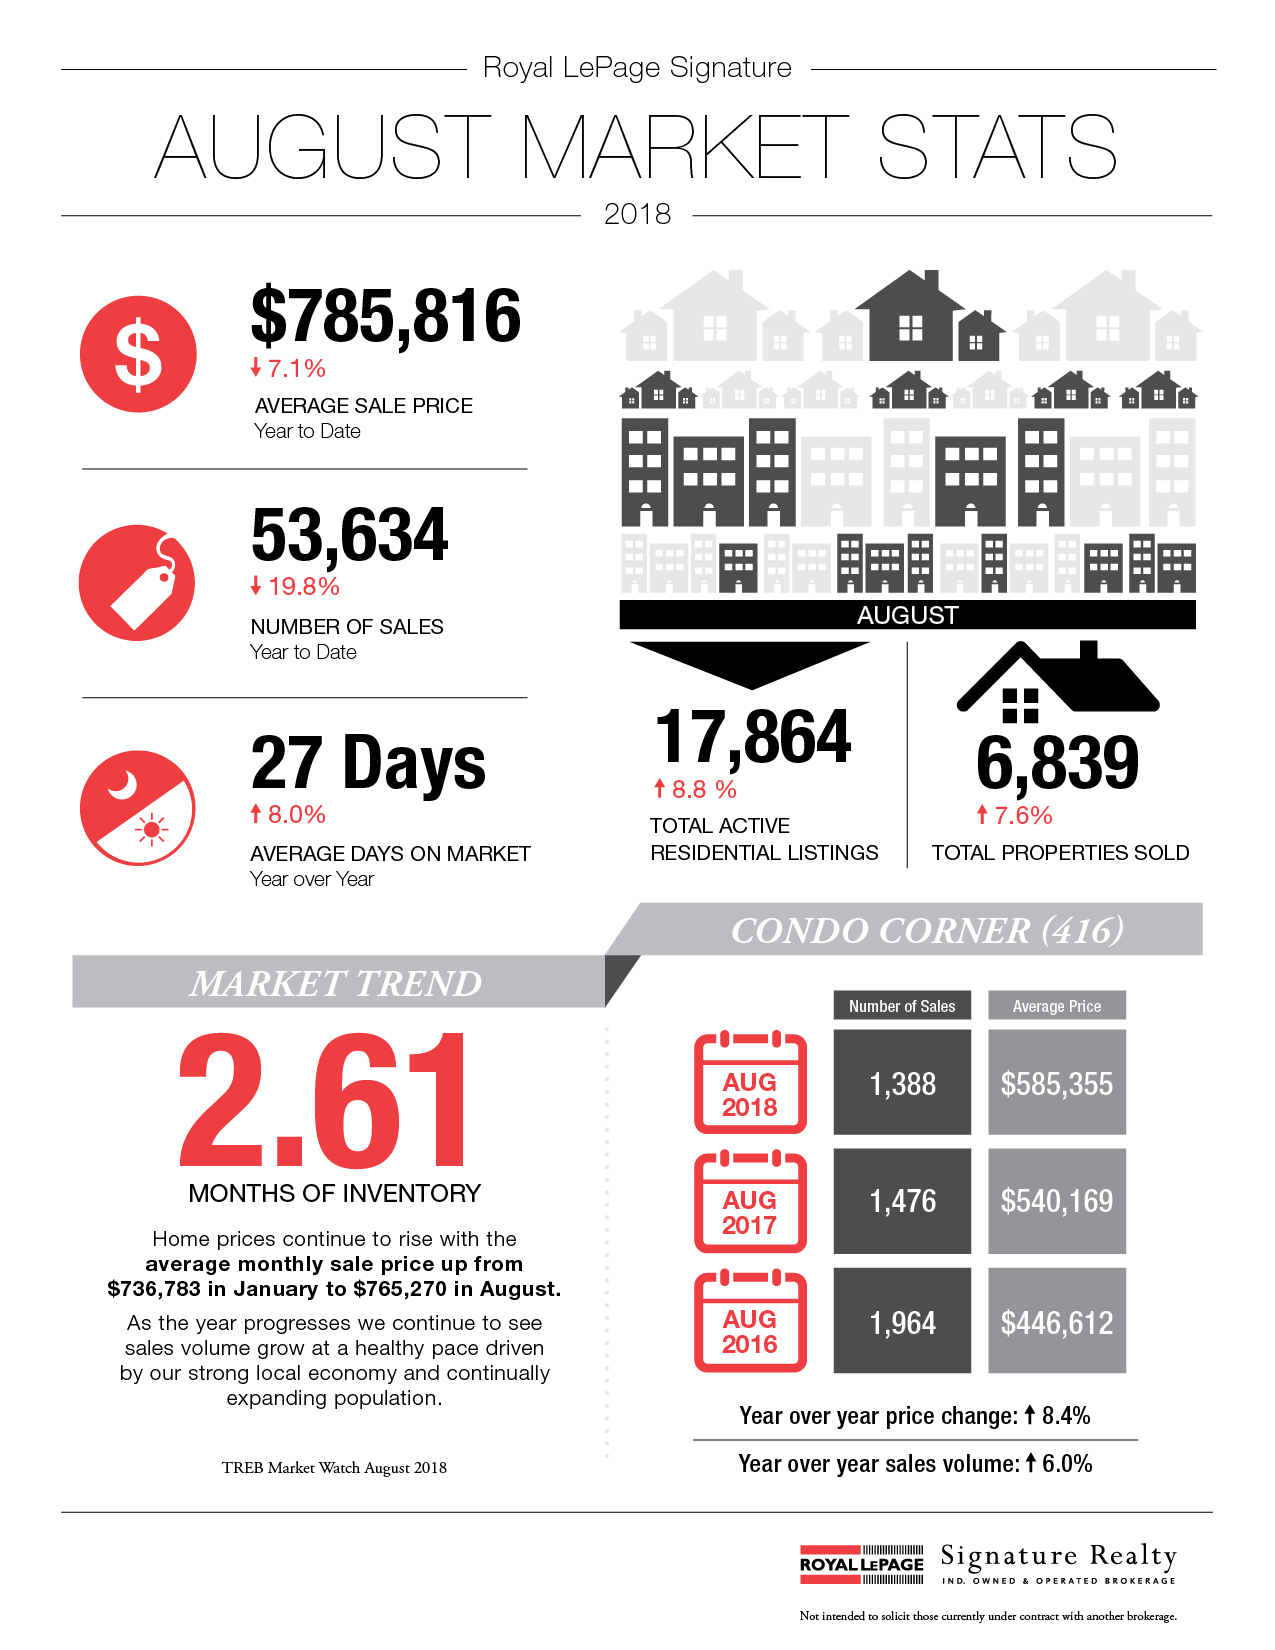
And here’s TREB’s official market report for the month of August 2018:

Toronto Real Estate Board President Garry Bhaura announced sales and price increases on a year-over-year basis in August.

Greater Toronto Area REALTORS® reported 6,839 sales through TREB’s MLS® System in August 2018 – an 8.5 per cent increase compared to August 2017.

Both the average selling price, at $765,270, and the MLS® Home Price Index Composite Benchmark for August 2018 were up compared to the same month in 2017, by 4.7 per cent and 1.5 per cent respectively.

The average selling price increased by more than the MLS® HPI Composite due, at least in part, to a change in the mix of sales compared to last year.

Detached home sales were up by double digits on a year-over-year percentage basis – substantially more than many other less-expensive home types.

“It is encouraging to see a continued resurgence in the demand for ownership housing. Many home buyers who had initially moved to the sidelines due to the Ontario Fair Housing Plan and new mortgage lending guidelines have renewed their search for a home and are getting deals done much more so than last year. In a region where the economy remains strong and the population continues to grow, ownership housing remains a solid long-term investment,” said Mr. Bhaura.

Month-over-month sales and price growth also continued in August.

On a preliminary seasonally adjusted basis, August 2018 sales were up by two per cent compared to July 2018.

The seasonally adjusted August 2018 average selling price was down slightly by 0.2 per cent compared to July 2018, following strong monthly increases in May, June and July.

“Market conditions in the summer of 2018, including this past August, were tighter than what was experienced in the summer of 2017. In August, the annual rate of sales growth outpaced the annual rate of new listings growth. We only have slightly more than two-and-a-half months of inventory in the TREB market area as a whole and less than two months of inventory in the City of Toronto. This means that despite the fact the sales remain off the record highs from 2016 and 2017, many GTA neighbourhoods continue to suffer from a lack of inventory. This could present a problem if demand continues to accelerate over the next year, which is expected,” said Jason Mercer, TREB’s Director of Market Analysis.

If you’re thinking of making a move and would like to know how we can help, please contact us for more info.

July 2018 Market Stats: Infographic & Report

 
2018-08-05 - July Market Stats.jpg
 

July 2018 market stats are here!

The average sale price for the month was $782,129, up 4.8% compared to July 2017.

Here’s a breakdown of the average sale prices & year-over-year increases/decreases for the 416 area code:

  • Detached = $1,350,700 (+3.6%)

  • Semi-Detached = $935,300 (+7.4%)

  • Townhouse = $718,698 (+1.5%)

  • Condo Apartment = $582,547 (+9.2%)

And here’s TREB’s official market report for the month of July 2018:

Toronto Real Estate Board President Garry Bhaura announced strong growth in the number of home sales and the average selling price reported by Greater Toronto Area REALTORS® in July 2018.

“Home sales result in substantial spin-off benefits to the economy, so the positive results over the last two months are encouraging. However, no one will argue that housing supply remains an issue. The new provincial government and candidates for the upcoming municipal elections need to concentrate on policies focused on enhancing the supply of housing and reducing the upfront tax burden represented by land transfer taxes, province-wide and additionally in the City of Toronto,” said Mr. Bhaura.

Residential sales reported through TREB’s MLS® System for July 2018 amounted to 6,961 – up 18.6 per cent compared to July 2017.

Over the same period, the average selling price was up by 4.8 per cent to $782,129, including a moderate increase for detached home types.

New listings in July 2018 were down by 1.8 per cent year-over-year.

Preliminary seasonal adjustment pointed to strong month-over-month increases of 6.6 per cent and 3.1 per cent respectively for sales and average price.

Seasonally adjusted sales were at the highest level for 2018 and the seasonally adjusted average price reached the highest level since May 2017.

The MLS® Home Price Index (HPI) Composite Benchmark for July 2018 was down slightly compared to July 2017.

However, the annual growth rate looks to be trending toward positive territory in the near future.

“We have certainly experienced an increase in demand for ownership housing so far this summer. It appears that some people who initially moved to the sidelines due to the psychological impact of the Fair Housing Plan and changes to mortgage lending guidelines have re-entered the market. Home buyers in the GTA recognize that ownership housing is a quality long-term investment,” said Jason Mercer, TREB’s Director of Market Analysis.

If you’re thinking of making a move and would like to know how we can help, please contact us for more info.

June 2018 Market Stats: Infographic & Report

 
2018-07-06 - June Market Stats.jpg
 

June 2018 market stats are here!

The average sale price for the month was $807,871, up 2.0% compared to June 2017.

Here’s a breakdown of the average sale prices & year-over-year increases/decreases for the 416 area code:

  • Detached = $1,354,429 (-2.4%)

  • Semi-Detached = $999,754 (+1.4%)

  • Townhouse = $736,963 (+5.6%)

  • Condo Apartment = $605,530 (+9.5%)

And here’s TREB’s official market report for the month of June 2018:

Toronto Real Estate Board President Garry Bhaura, in his first market release as TREB President, is pleased to announce some positive signs with respect to the housing market.

Greater Toronto Area REALTORS® reported 8,082 home sales through TREB’s MLS® System in June 2018 – up 2.4 per cent compared to the low June 2017 result.

After preliminary seasonal adjustment, sales were also up 17.6 per cent on a monthly basis between May 2018 and June 2018, continuing the trend of somewhat volatile month-over-month changes over the past year as home buyers reacted to various policy changes impacting the market.

“Home ownership has proven to be a positive long-term investment. After some adjustment to the Fair Housing Plan, the new Office of The Superintendent of Financial Institutions (OSFI) stress test requirement and generally higher borrowing costs, home buyers are starting to move back into the market, with sales trending up from last year’s lows. Market conditions appear to be tightening, with sales accounting for a greater share of listings, as new listings have dropped compared to last year,” said Mr. Bhaura.

The average selling price edged up by two per cent on a year-over-year basis to $807,871 in June 2018.

After preliminary seasonal adjustment, the average selling price was also up by 3.3 per cent month-over-month between May 2018 and June 2018.

The MLS® Home Price Index (HPI) was down by 4.8 per cent on a year-over-year basis, but remained basically flat month-over-month.

The difference in the year-over-year rates of change between the average price and the MLS® HPI was likely due, at least in part, to a change in the mix of properties sold in June 2018 compared to June 2017, with low-rise home types accounting for a greater share of sales in June 2018.

“The expectation is to see improvement in sales over the next year. Over the same period, however, it is likely that issues surrounding the supply of listings will persist. This suggests that competition between buyers could increase, exerting increased upward pressure on home prices. With a new provincial government in place and municipal elections on the horizon, housing supply should be top-of-mind for policy makers,” said Jason Mercer, TREB’s Director of Market Analysis and Service Channels.

If you’re thinking of making a move and would like to know how we can help, please contact us for more info.

May 2018 Market Stats: Infographic & Report

 
11.jpg
 

May 2018 market stats are here!

The average sale price for the month was $805,320, down 6.6% compared to May 2017.

Here’s a breakdown of the average sale prices & year-over-year increases/decreases for the 416 area code:

  • Detached = $1,426,094 (-5.6%)

  • Semi-Detached = $1,067,128 (+0.3%)

  • Townhouse = $741,296 (-0.1%)

  • Condo Apartment = $602,804 (+6.5%)

And here’s TREB’s official market report for the month of May 2018:

Greater Toronto Area REALTORS® reported 7,834 sales through TREB’s MLS® System in May 2018.

This result was down by 22.2 per cent compared to May 2017.

While the number of sales was down year-over-year, the annual rate of decline was less than reported in February, March and April, when sales were down by more than 30 per cent.

On a month-over-month basis, seasonally adjusted May sales were basically flat compared to April.

Supply of homes available for sale continued to be an issue.

New listings were down by 26.2 per cent.

The fact that new listings were down by more than sales in comparison to last year means that competition increased between buyers.

Recent polling conducted by Ipsos for TREB suggests that listing intentions are down markedly since the fall.

“Home ownership remains a sound long-term investment. Unfortunately, many home buyers are still finding it difficult find a home that meets their needs. In a recent Canadian Centre for Economic Analysis study undertaken for the Toronto Real Estate Board, it was found that many people are over-housed in Ontario, with over five million extra bedrooms. These people don’t list their homes for sale, because they feel there are no alternative housing types for them to move into. Policy makers need to focus more on the ‘missing middle’ – home types that bridge the gap between detached houses and condominium apartments,” said Mr. Syrianos.

The MLS® Home Price Index (HPI) Composite Benchmark was down by 5.4 per cent year-over- year.

The average selling price for all home types combined was down by 6.6 per cent to $805,320.

On a seasonally adjusted basis, the average selling price was up by 1.1 per cent compared to April 2018.

“Market conditions are becoming tighter in the Greater Toronto Area and this will provide support for home prices as we move through the second half of 2018 and into 2019. There are emerging indicators pointing toward increased competition between buyers, which generally leads to stronger price growth. In the City of Toronto, for example, average selling prices were at or above average listing prices for all major home types in May,” said Jason Mercer, TREB’s Director of Market Analysis.

If you’re thinking of making a move and would like to know how we can help, please contact us for more info.

April 2018 Market Stats: Infographic & Report

 
RLPS_Apr_Infographic_DT_Let_May3_2018.jpg
 

April 2018 market stats are here!

The average sale price for the month was $804,584, down 12.4% compared to April 2017.

Here’s a breakdown of the average sale prices & year-over-year increases/decreases for the 416 area code:

  • Detached = $1,354,719 (-14.3%)

  • Semi-Detached = $1,021,986 (-7.8%)

  • Townhouse = $792,180 (+.02%)

  • Condo Apartment = $601,211 (+3.8%)

And here’s TREB’s official market report for the month of April 2018:

Toronto Real Estate Board President Tim Syrianos announced that Greater Toronto Area REALTORS® reported 7,792 sales through TREB’s MLS® System in April 2018.

The average selling price was $804,584.

On a year-over-year basis, sales were down by 32.1 per cent and the average selling price was down by 12.4 per cent.

The year-over-year change in the overall average selling price has been impacted by both changes in market conditions as well as changes in the type and price point of homes being purchased.

This is especially clear at the higher end of the market.

Detached home sales for $2 million or more accounted for 5.5 per cent of total detached sales in April 2018, versus 10 per cent in April 2017.

The MLS® Home Price Index strips out the impact of changes in the mix of home sales from one year to the next.

This is why the MLS® HPI Composite Benchmark was down by only 5.2 per cent year-over-year versus 12.4 per cent for the average price.

“While average selling prices have not climbed back to last year’s record peak, April’s price level represents a substantial gain over the past decade. Recent polling conducted for TREB by Ipsos tells us that the great majority of buyers are purchasing a home within which to live. This means these buyers are treating home ownership as a long-term investment. A strong and diverse labour market and continued population growth based on immigration should continue to underpin long-term home price appreciation,” said Mr. Syrianos.

“The comparison of this year’s sales and price figures to last year’s record peak masks the fact that market conditions should support moderate increases in home prices as we move through the second half of the year, particularly for condominium apartments and higher density low-rise home types. Once we are past the current policy-based volatility, home owners should expect to see the resumption of a moderate and sustained pace of price growth in line with a strong local economy and steady population growth,” said Jason Mercer, TREB’s Director of Market Analysis.

If you’re thinking of making a move and would like to know how we can help, please contact us for more info.

February 2018 Market Stats: Infographic & Report

 
TREB-Stats-February-2018.jpg
 

February 2018 market stats are here!

The average sale price for the month was $767,818, down 12.4% compared to February 2017.

Here’s a breakdown of the average sale prices & year-over-year increases/decreases for the 416 area code:

  • Detached = $1,282,240 (-18.6%)

  • Semi-Detached = $985,902 (-9.0%)

  • Townhouse = $776,642 (+15.5%)

  • Condo Apartment = $570,275 (+10.7%)

And here’s TREB’s official market report for the month of February 2018:

Toronto Real Estate Board President Tim Syrianos announced that Greater Toronto Area REALTORS® reported 5,175 residential transactions through TREB’s MLS® System in February 2018.

This result was down 34.9 percent compared to the record 7,955 sales reported in February 2017.

The number of new listings entered into TREB’s MLS® System totaled 10,520, a 7.3 per cent increase compared to the 9,801 new listings entered in February 2017.

However, the level of new listings remained below the average for the month of February for the previous 10 years.

“When TREB released its Outlook for 2018, the forecast anticipated a slow start to the year compared to the historically high sales count reported in the winter and early spring of 2017. Prospective home buyers are still coming to terms with the psychological impact of the Fair Housing Plan, and some have also had to reevaluate their plans due to the new OFSI-mandated mortgage stress test guidelines and generally higher borrowing costs,” said Mr. Syrianos.

The MLS® Home Price Index Composite Benchmark was up by 3.2 per cent on a year-over-year basis for the TREB market area as a whole.

This growth was driven by the apartment and townhouse market segments, with annual benchmark price increases of 18.8 per cent and 7.5 per cent respectively.

Single-family detached and attached benchmark prices were down slightly compared to February 2017.

The overall average selling price for February sales was down 12.4% year-over-year to $767,818.

However, putting aside the price spike reported in the first quarter of 2017, it is important to note that February’s average price remained 12 per cent higher than the average reported for February 2016, which represents an annualized increase well above the rate of inflation for the past two years.

“As we move further into the spring and summer months, growth in sales and selling prices is expected to pick up relative to last year. Expect stronger price growth to continue in the comparatively more affordable townhouse and condominium apartment segments. This being said, listings supply will likely remain below average in many neighbourhoods in the GTA, which, over the long-term, could further hamper affordability,” said Jason Mercer, TREB’s Director of Market Analysis.

If you’re thinking of making a move and would like to know how we can help, please contact us for more info.

December 2017 Market Stats: Infographic & Report

 
December-2017-Stats.jpg
 

December 2017 market stats are here!

The average sale price for the month was $735,021, up 0.7% compared to December 2016.

Here’s a breakdown of the average sale prices & year-over-year increases/decreases for the 416 area code:

  • Detached = $1,250,235 (-2.8%)

  • Semi-Detached = $903,658 (+11.5%)

  • Townhouse = $649,294 (-2.4%)

  • Condo Apartment = $532,700 (+14.1%)

And here’s TREB’s official market report for the month of December 2017 (and an overview of the year in general):

Toronto Real Estate Board President Tim Syrianos announced that Greater Toronto Area REALTORS® reported 92,394 sales through TREB's MLS® System in 2017.

This total was down 18.3 per cent compared to the record set in 2016.

Record sales in Q1 were followed by a decline in Q2 and Q3 after the Ontario Fair Housing Plan (FHP) was announced.

The pace of sales picked up in Q4, as the impact of the FHP started to wane, and some buyers arguably brought forward their home purchase in response to the new OSFI stress test guidelines effective January 1, 2018.

"Much of the sales volatility in 2017 was brought about by government policy decisions. Research from TREB, the provincial government and Statistics Canada showed that foreign home buying was not a major driver of sales in the GTA. However, the Ontario Fair Housing Plan, which included a foreign buyer tax, had a marked psychological impact on the marketplace. Looking forward, government policy could continue to influence consumer behavior in 2018, as changes to federal mortgage lending guidelines come into effect," said Mr. Syrianos.

The average selling price for 2017 as a whole was $822,681 – up 12.7 per cent compared to 2016.

This annual growth was driven more so by extremely tight market conditions during the first four months of the year.

In the latter two-thirds of 2017, fewer sales combined with increased listings resulted in slower price growth.

In December, the MLS® Home Price Index (HPI) Composite Benchmark was up by 7.2 per cent year over year, and the overall average selling price was up by 0.7 per cent year over year.

"It is interesting to note that home price growth in the second half of 2017 differed substantially depending on market segment. The detached market segment – the most expensive on average – experienced the slowest pace of growth as many buyers looked to less expensive options. Conversely, the condominium apartment segment experienced double-digit growth, as condos accounted for a growing share of transactions," said Jason Mercer, TREB's Director of Market Analysis.

If you’re thinking of making a move and would like to know how we can help, please contact us for more info.

November 2017 Market Stats: Infographic & Report

 
RLPS_Nov_Infographic_DT_Let_Dec5_2017.jpg
 

November 2017 market stats are here!

The average sale price for the month was $761,757, down 2.0% compared to November 2016.

Here’s a breakdown of the average sale prices & year-over-year increases/decreases for the 416 area code:

  • Detached = $1,276,184 (-5.1%)

  • Semi-Detached = $904,711 (-0.7%)

  • Townhouse = $760,501 (+12.3%)

  • Condo Apartment = $555,396 (+17.7%)

And here’s TREB’s official market report for the month November 2017:

Toronto Real Estate Board President Tim Syrianos announced that Greater Toronto Area REALTORS® reported 7,374 transactions through TREB's MLS® System in November 2017.

This result was up compared to October 2017, bucking the regular seasonal trend.

On a year-over-year basis, sales were down by 13.3 per cent compared to November 2016.

New listings entered into TREB's MLS® System in November 2017 amounted to 14,349 – up by 37.2 per cent compared to November 2016, when the supply of listings was very low from a historic perspective.

"We have seen an uptick in demand for ownership housing in the GTA this fall, over and above the regular seasonal trend. Similar to the Greater Vancouver experience, the impact of the Ontario Fair Housing Plan and particularly the foreign buyer tax may be starting to wane. On top of this, it is also possible that the upcoming changes to mortgage lending guidelines, which come into effect in January, have prompted some households to speed up their home buying decision," said Mr. Syrianos.

The MLS® Home Price Index (HPI) composite benchmark price was up by 8.4 per cent on a year-over-year basis in November 2017.

The average selling price for all home types combined was down by two per cent compared to November 2016, due in large part to a smaller share of detached home sales versus last year.

On a year-to-date basis, the average selling price was up by 13.4 per cent compared to the same period last year.

High density home types continued to lead the way in terms of price growth, with the average condominium apartment price up by double-digits compared to November 2016.

"Changes in market conditions have not been uniform across market segments. In line with insights from consumer polling undertaken by Ipsos in the spring, we are still seeing seller's market conditions for townhouses and condominium apartments in many neighbourhoods versus more balanced market conditions for detached and semi-detached houses. We will have more insights to share about consumer intentions for 2018 at the end of January when TREB releases its third annual Market Year in Review and Outlook report," said Jason Mercer, TREB's Director of Market Analysis.

If you’re thinking of making a move and would like to know how we can help, please contact us for more info.

October 2017 Market Stats: Infographic & Report

 
RLPS_Oct_Infographic_DT_Let_Nov3_2017.jpg
 

October 2017 market stats are here!

The average sale price for the month was $780,104, up 2.3% over October 2016.

Here’s a breakdown of the average sale prices & year-over-year increases for the 416 area code:

  • Detached = $1,287,765 (-1.1%)

  • Semi-Detached = $948,309 (+5.2%)

  • Townhouse = $742,845 (+8.0%)

  • Condo Apartment = $555,004 (+20.9%)

And here’s TREB’s official market report for the month October 2017:

Toronto Real Estate Board President Tim Syrianos reported 7,118 residential sales through TREB's MLS® System in October 2017. This result represented an above-average increase between September and October of almost 12 per cent, pointing to stronger fall market conditions.

On a year-over-year basis, October sales were down compared to 9,715 transactions in September 2016. Total sales reported through the first 10 months of 2017 amounted to 80,198 – down from 99,233 for the same time period in 2016.

"Every year we generally see a jump in sales between September and October. However, this year that increase was more pronounced than usual compared to the previous ten years. So, while the number of transactions was still down relative to last year's record pace, it certainly does appear that sales momentum is picking up," said Mr. Syrianos.

The MLS® Home Price Index Composite benchmark price was up by 9.7 per cent on a year-over-year basis in October.

Annual rates of price growth were strongest for townhouses and condominium apartments.

The average selling price for October transactions was $780,104 – up by 2.3 per cent compared to the average of $762,691 in October 2016.

"The housing market in the GTA has been impacted by a number of policy changes at the provincial and federal levels. Similar to the track followed in the Greater Vancouver Area, it appears that the psychological impact of the Fair Housing Plan, including the tax on foreign buyers, is starting to unwind," said Jason Mercer, TREB's Director of Market Analysis.

If you’re thinking of making a move and would like to know how we can help, please contact us for more info.

September 2017 Market Stats: Infographic & Report

September 2017 Market Stats: Infographic & Report Photo September 2017 market stats are here!

The average sale price for the month was $775,546, up 2.6% over September 2016.

Here's a breakdown of the average sale prices & year-over-year increases for the 416 area code:

  • Detached = $1,355,234 (+4.4%)
  • Semi-Detached = $935,467 (+5.2%)
  • Townhouse = $685,016 (+4.8%)
  • Condo Apartment = $554,069 (+24.0%)

And here's TREB’s official market report for the month September 2017:

Toronto Real Estate Board President Tim Syrianos announced that Greater Toronto Area REALTORS® reported 6,379 sales through TREB's MLS® System in September 2017. This result was down by 35 per cent compared to September 2016.

The number of new listings entered into TREB's MLS® System amounted to 16,469 in September – up by 9.4 per cent year-over-year.

"The improvement in listings in September compared to a year earlier suggests that home owners are anticipating an uptick in sales activity as we move through the fall. Consumer polling undertaken for TREB in the spring suggested that buying intentions over the next year remain strong. As we move through the fourth quarter we could see some buyers moving off the sidelines, taking advantage of a better-supplied marketplace," said Mr. Syrianos.

The average selling price in September 2017 was $775,546 – up 2.6 per cent compared to September 2016.

The MLS® Home Price Index (HPI) composite benchmark was up by 12.2 per cent on a year-over-year basis.

A key reason for the difference in annual growth rates between the average price and the MLS® HPI composite is the fact that detached homes – the most expensive market segment on average – accounted for a smaller share of overall transactions this year compared to last.

"With more balanced market conditions, the pace of year-over-year price growth was more moderate in September compared to a year ago. However, the exception was the condominium apartment market segment, where average and benchmark sales prices were up by more than 20 per cent compared to last year. Tighter market conditions for condominium apartments follows consumer polling results from the spring that pointed toward a shift to condos in terms of buyer intentions," said Jason Mercer, TREB's Director of Market Analysis.


If you’re thinking of making a move and would like to know how I can help, feel free to contact me for more info.

For complete copies of TREB’s Monthly Market Watch Reports, visit my archives here.

August 2017 Market Stats: Infographic & Report

August 2017 Market Stats: Infographic & Report Photo Following is TREB’s market report for August 2017:

Toronto Real Estate Board President Tim Syrianos announced that Greater Toronto Area REALTORS® reported 6,357 home sales through TREB's MLS® System in August 2017. This result was down by 34.8 per cent compared to August 2016.

The number of new listings entered into TREB's MLS® System, at 11,523, was down by 6.7 per cent year-over-year and was at the lowest level for August since 2010.

"Recent reports suggest that economic conditions remain strong in the GTA. Positive economic news coupled with the slower pace of price growth we are now experiencing could prompt an improvement in the demand for ownership housing, over and above the regular seasonal bump, as we move through the fall," continued Mr. Syrianos.

The average selling price for all home types combined was $732,292 – up by three per cent compared to August 2016. This growth was driven by the semi-detached, townhouse and condominium apartment market segments that continued to experience high single-digit or double digit year-over-year average price increases.

The MLS® Home Price Index composite benchmark, which accounts for typical home types throughout TREB's market area, was up by 14.3 per cent year-over-year in August. The fact that MLS® HPI growth outstripped average price growth, points to fewer high-end home sales this year compared to last.

"The relationship between sales and listings in the marketplace today suggests a balanced market. If current conditions are sustained over the coming months, we would expect to see year-over-year price growth normalize slightly above the rate of inflation. However, if some buyers move from the sidelines back into the marketplace, as TREB consumer research suggests may happen, an acceleration in price growth could result if listings remain at current levels," said Jason Mercer, TREB's Director of Market Analysis.


If you’re thinking of making a move and would like to know how I can help, feel free to contact me for more info.

For complete copies of TREB’s Monthly Market Watch Reports, visit my archives here.

June 2017 Market Stats: Infographic & Report

June 2017 Market Stats: Infographic & Report Photo Following is TREB’s market report for June 2017:

Greater Toronto Area REALTORS® reported 7,974 sales through TREB's MLS® System in June 2017 – down by 37.3 per cent in comparison to June 2016.

The number of new residential listings entered into TREB's MLS® System, at 19,614, was up by 15.9 per cent compared to June 2016.

While this annual rate of growth was sizeable, it represented a more moderate annual rate of growth compared to May 2017, when new listings were up by 48.9 per cent year-over-year.

"We are in a period of flux that often follows major government policy announcements pointed at the housing market. On one hand, consumer survey results tell us many households are very interested in purchasing a home in the near future, but some of these would-be buyers seem to be temporarily on the sidelines waiting to see the real impact of the Ontario Fair Housing Plan. On the other hand, we have existing home owners who are listing their home because they feel price growth may have peaked. The end result has been a better supplied market and a moderating annual pace of price growth," said Mr. Syrianos.

Annual growth rates for MLS® HPI benchmark prices have moderated over the past two months, but remain strong.

The MLS® HPI composite benchmark price was up by 25.3 per cent on a year-over-year basis in June.

June's average selling price for all home types combined for the TREB market area was $793,915, representing a 6.3 per cent increase compared to the same month in 2016.

A better supplied market has certainly been a key factor influencing the moderation in price growth.

"Recent Ipsos survey results suggest that home buying activity in the GTA will remain strong moving forward. The year-over-year dip in home sales we have experienced over the last two months seem to be the result of would-be buyers putting their decision to purchase temporarily on hold while they monitor the impact of the Fair Housing Plan. On the supply side of the market, it certainly looks as though buyers will benefit from more choice in the second half of 2017 compared to the same period in 2016,"said Jason Mercer, TREB's Director of Market Analysis and Service Channels.


If you’re thinking of making a move and would like to know how I can help, feel free to contact me for more info.

For complete copies of TREB’s Monthly Market Watch Reports, visit my archives here.

April 2017 Market Stats: Infographic & Report

April 2017 Market Stats: Infographic & Report Photo Following is TREB’s market report for April 2017:

Toronto Real Estate Board President Larry Cerqua announced that Greater Toronto Area REALTORS® entered 33.6 per cent more new listings into TREB's MLS® System in April 2017, at 21,630, compared to the same month in 2016.

New listings were up by double-digits for all low-rise home types, including detached and semi-detached houses and townhouses.

New listings for condominium apartments were at the same level as last year.

Total sales for the TREB market area as a whole amounted to 11,630 – down 3.2 per cent year-over-year.

One issue underlying this decline was the fact that Easter fell in April in 2017 versus March in 2016, which resulted in fewer working days this year compared to last and, historically, most sales are entered into TREB's MLS® System on working days.

"The fact that we experienced extremely strong growth in new listings in April means that buyers benefitted from considerably more choice in the marketplace. It is too early to tell whether the increase in new listings was simply due to households reacting to the strong double-digit price growth reported over the past year or if some of the increase was also a reaction to the Ontario government's recently announced Fair Housing Plan," said Mr. Cerqua.

The MLS® Home Price Index (HPI) Composite Benchmark Price was up by 31.7 per cent yearover- year in April 2017. Similarly, the average selling price for all home types combined was up by 24.5 per cent to $920,791.

"It was encouraging to see a very strong year-over-year increase in new listings. If new listings growth continues to outpace sales growth moving forward, we will start to see more balanced market conditions. It will likely take a number of months to unwind the substantial pent-up demand that has built over the past two years. Expect annual rates of price growth to remain well-above the rate of inflation as we move through the spring and summer months," said Jason Mercer, TREB's Director of Market Analysis.


If you’re thinking of making a move and would like to know how I can help, feel free to contact me for more info.

For complete copies of TREB’s Monthly Market Watch Reports, visit my archives here.

Point-By-Point: Ontario's Fair Housing Plan

Ontario's Fair Housing Plan: Point-By-Point Photo

.

Today, Premier Kathleen Wynne finally announced changes to real estate in Ontario in an attempt to increase supply and address affordability.

No doubt, there's going to be some confusion about the effects of the changes. Keep in mind though, the fundamentals of a healthy market have not changed.

Take a look at the plan below, point-by-point. If you've got any questions just give me a shout.

There are 16 proposed measures:

  1. A 15-per-cent non-resident speculation tax to be imposed on buyers in the Greater Golden Horseshoe area who are not citizens, permanent residents or Canadian corporations.

  2. Expanded rent control that will apply to all private rental units in Ontario, including those built after 1991, which are currently excluded.

  3. Updates to the Residential Tenancies Act to include a standard lease agreement, tighter provisions for “landlord’s own use” evictions, and technical changes to the Landlord-Tenant Board meant to make the process fairer, as well as other changes.

  4. A program to leverage the value of surplus provincial land assets across the province to develop a mix of market-price housing and affordable housing.

  5. Legislation that would allow Toronto and possibly other municipalities to introduce a vacant homes property tax in an effort to encourage property owners to sell unoccupied units or rent them out.

  6. A plan to ensure property tax for new apartment buildings is charged at a similar rate as other residential properties.

  7. A five-year, $125-million program aimed at encouraging the construction of new rental apartment buildings by rebating a portion of development charges.

  8. More flexibility for municipalities when it comes to using property tax tools to encourage development.

  9. The creation of a new Housing Supply Team with dedicated provincial employees to identify barriers to specific housing development projects and work with developers and municipalities to find solutions.

  10. An effort to understand and tackle practices that may be contributing to tax avoidance and excessive speculation in the housing market.

  11. A review of the rules real estate agents are required to follow to ensure that consumers are fairly represented in real estate transactions.

  12. The launch of a housing advisory group which will meet quarterly to provide the government with ongoing advice about the state of the housing market and discuss the impact of the measures and any additional steps that are needed.

  13. Education for consumers on their rights, particularly on the issue of one real estate professional representing more than one party in a real estate transaction.

  14. A partnership with the Canada Revenue Agency to explore more comprehensive reporting requirements so that correct federal and provincial taxes, including income and sales taxes, are paid on purchases and sales of real estate in Ontario.

  15. Set timelines for elevator repairs to be established in consultation with the sector and the Technical Standards & Safety Authority.

  16. Provisions that would require municipalities to consider the appropriate range of unit sizes in higher density residential buildings to accommodate a diverse range of household sizes and incomes, among other things.


If you’re thinking of making a move and would like to know how I can help, feel free to contact me for more info.


March 2017 Market Stats: Infographic & Report

March 2017 Market Stats: Infographic & Report Photo Following is TREB’s market report for March 2017:

Toronto Real Estate Board President Larry Cerqua announced that Greater Toronto Area REALTORS® reported 12,077 residential sales through TREB’s MLS® System in March 2017.

This result represented a 17.7 per cent increase compared to the 10,260 sales reported in March 2016.

For the TREB market area as a whole, annual sales growth was strongest for condominium apartments and detached houses.

The number of new listings also increased on a year-over-year basis, at 17,051 – a 15.2 per cent increase compared to March 2016.

The strongest growth in new listings was experienced in the detached market segment.

While new listings were up strongly compared to last year, the rate new listings growth was still lower than the rate of sales growth.

As a result, GTA market conditions continued to tighten.

“It has been encouraging to see that policymakers have not implemented any knee-jerk policies regarding the GTA housing market. Different levels of government are holding consultations with market stakeholders and TREB has participated and will continue to participate in these discussions. Policy makers must remember that it is the interplay between the demand for and supply of listings that influences price growth,” said Mr. Cerqua.

Strong competition between buyers continued to cause high levels of price growth in all major market segments.

The MLS® Home Price Index (HPI) Composite Benchmark Price was up by 28.6 per cent year-over-year.

For the TREB market area as a whole, the average selling price was up by 33.2 per cent, with similar annual rates of growth in the low-rise and condominium apartment segments.

“Annual rates of price growth continued to accelerate in March as growth in sales outstripped growth in listings. A substantial period of months in which listings growth is greater than sales growth will be required to bring the GTA housing market back into balance. As policy makers seek to achieve this balance, it is important that an evidence-based approach is followed,” said Jason Mercer, TREB’s Director of Market Analysis.


If you’re thinking of making a move and would like to know how I can help, feel free to contact me for more info.

For complete copies of TREB’s Monthly Market Watch Reports, visit my archives here.

February 2017 Market Stats: Infographic & Report

February 2017 Market Stats: Infographic & Report Photo Following is TREB’s market report for February 2017:

Toronto Real Estate Board President Larry Cerqua announced that Greater Toronto Area REALTORS® reported 8,014 residential sales through TREB’s MLS® System in February 2017.

Despite the fact that February 2016 had one more day due to the leap year day, this result was up on a year-over-year basis by 5.7 per cent compared to 7,583 sales reported last year.

“The February statistics tell me that many Greater Toronto Area households continue to view home ownership as a great long-term investment. The high demand for ownership housing we’re seeing is broad-based, with strong sales growth for most low-rise home types and condominium apartments. This makes sense given the results of a recent consumer survey undertaken for TREB by Ipsos, which found an even split between intending first-time buyers and existing homeowners who indicated that they were planning on purchasing a home in 2017,” said Cerqua.

While the demand for ownership housing grew over the past year, new listings entered into TREB's MLS® System in February were down on a year-over-year basis by 12.5 per cent to 9,834.

The MLS® HPI Composite Benchmark Price was up by 23.8 per cent compared to February 2016.

Similarly, the average selling price was up by 27.7 per cent year-over-year to $875,983.

Annual rates of price growth continued to be strongest for low-rise home types, particularly detached houses.

Growth rates for condominium apartment prices were also in the double digits, likely a result of strong demand from first-time buyers.

"The listing supply crunch we are experiencing in the GTA has undoubtedly led to the double- digit home price increases we are now experiencing on a sustained basis, both in the low-rise and high-rise market segments. Until we see a marked increase in the number of homes available for sale, expect very strong annual rates of price growth to continue," said Jason Mercer, TREB's Director of Market Analysis.


If you’re thinking of making a move and would like to know how I can help, feel free to contact me for more info.

For complete copies of TREB’s Monthly Market Watch Reports, visit my archives here.


January 2017 Market Stats: Infographic & Report

January 2017 Market Stats: Infographic & Report Photo Following is TREB’s market report for January 2017:

Toronto Real Estate Board President Larry Cerqua announced that Greater Toronto Area REALTORS® reported 5,188 residential transactions through TREB's MLS® System in January 2017.

This result was up by 11.8 per cent compared to 4,640 sales reported in January 2016.

Annual rates of sales growth were higher for condominium apartments than for low-rise home types.

January 2017 picked up where 2016 left off: sales were up on a year-over-year basis while the number of new listings was down by double-digit annual rates for most major home types.

"Home ownership continues to be a great investment and remains very important to the majority of GTA households. As we move through 2017, we expect the demand for ownership housing to remain strong, including demand from first-time buyers who, according to a recent Ipsos survey, could account for more than half of transactions this year. However, many of these would-be buyers will have problems finding a home that meets their needs in a market with very little inventory," said Cerqua.

The MLS® Home Price Index (HPI) Composite Benchmark price was up by 21.8 per cent on a year-over-year basis in January.

Similarly, over the same period, the average selling price was up by 22.3 per cent to $770,745, with double-digit gains in the average prices for all major home types.

"The number of active listings on TREB's MLS® System at the end of January was essentially half of what was reported as available at the same time last year. That statistic, on its own, tells us that there is a serious supply problem in the GTA – a problem that will continue to play itself out in 2017. The result will be very strong price growth for all home types again this year," said Jason Mercer, TREB's Director of Market Analysis.


If you’re thinking of making a move and would like to know how I can help, feel free to contact me for more info.

For complete copies of TREB’s Monthly Market Watch Reports, visit my archives here.

2016 Year In Review: Infographic & Report

January 2017 Market Stats: Infographic & Report Photo Following is TREB’s market report for the year 2016:

Toronto Real Estate Board President Larry Cerqua announced that 2016 was a second consecutive record year for home sales.

Greater Toronto Area REALTORS® reported 113,133 home sales through TREB’s MLS® System – up by 11.8 per cent compared to 2015.

The calendar year 2016 result included 5,338 sales in December – an annual increase of 8.6 per cent.

The strongest annual rate of sales growth in 2016 was experienced for condominium apartments followed by detached homes.

“A relatively strong regional economy, low unemployment and very low borrowing costs kept the demand for ownership housing strong in the GTA, as the region’s population continued to grow in 2016,” said Mr. Cerqua.

The annual rate of growth for the MLS® Home Price Index (HPI) in the TREB market area accelerated throughout 2016 – from 10.7 per cent in January 2016 to 21 per cent in December 2016.

The overall average selling price for calendar year 2016 was $729,922 – up 17.3 per cent compared to 2015.

The pace of the annual rate of growth for the average selling price also picked up throughout the year, including a climb of 20 per cent in December.

“Price growth accelerated throughout 2016 as the supply of listings remained very constrained. Active listings at the end of December were at their lowest point in a decade-and-a-half. Total new listings for 2016 were down by almost four per cent. In 2016, we saw policy changes and policy debates pointed at the demand side of the market. If we want to see a sustained moderation in the pace of price growth, what we really need is more policy focus on issues impacting the lack of homes available for sale,” said Jason Mercer, TREB’s Director of Market Analysis.


If you’re thinking of making a move and would like to know how I can help, feel free to contact me for more info.

For complete copies of TREB’s Monthly Market Watch Reports, visit my archives here.

October 2016 Market Stats: Infographic & Report

October 2016 Market Stats: Infographic & Report - Photo Following is TREB’s market report for October 2016:

Toronto Real Estate Board President Larry Cerqua announced that Greater Toronto Area REALTORS® reported a record 9,768 sales through TREB’s MLS® System in October 2016 – up by 11.5 per cent compared to October 2015.

For the TREB market area as a whole, the largest annual rate of sales growth was in the condominium apartment market segment.

Detached home sales were up by 10 per cent year-over-year, driven predominantly by transactions in the regions surrounding Toronto.

“The record pace of GTA home sales continued in October, with strong growth observed throughout the month. As we move through November and December, we will be watching the sales and listings trends closely, in light of the recent policy changes announced by the Federal Minister of Finance. TREB will once again be conducting consumer survey work, in order to report on home buying intentions for 2017,” said Mr. Cerqua.

The MLS® Home Price Index Composite Benchmark was up by 19.7 per cent on a year-over-year basis in October 2016.

Similarly, the average selling price for all home types combined was $762,975 – up 21.1 per cent over the same time period. Double-digit increases were experienced for all major home types for the TREB Market Area as a whole.

“New listings were up slightly in October compared to last year, but not nearly enough to offset the strong sales growth. This meant that seller’s market conditions continued to prevail as buyers of all home types experienced intense competition in the marketplace. Until we experience sustained relief in the supply of listings, the potential for strong annual rates of price growth will persist, especially in the low-rise market segments,” said Jason Mercer, TREB’s Director of Market Analysis.


If you’re thinking of making a move and would like to know how I can help, feel free to contact me for more info.

For complete copies of TREB’s Monthly Market Watch Reports, visit my archives here.

August 2016 Market Stats: Infographic & Report

August 2016 Market Stats: Infographic & Report Photo Following is TREB’s market report for August 2016:

Toronto Real Estate Board President Larry Cerqua announced that Greater Toronto Area REALTORS® reported a record 9,813 sales through TREB’s MLS® System in August 2016.

While this sales result was 23.5 per cent above the number of transactions reported for August 2015, it is important to note that the majority of sales are reported on working days and there were two additional working days in August 2016 compared to 2015.

When the year-over-year discrepancy in working days is accounted for, the annual percentage change in sales is closer to 13 per cent.

“The conditions underlying strong demand for ownership housing remained in place, including a relatively strong regional economy, growth in average earnings and low borrowing costs. Unfortunately, we did not see any relief on the listings front, with the number of new listings down compared to last year. This situation continued to underpin very strong home price growth, irrespective of home type or area,” said Mr. Cerqua.

The MLS® Home Price Index (HPI) Composite Benchmark for August 2016 was up by 17.2 per cent on a year-over-year basis.

Similarly, the average selling price for all home types combined was up by 17.7 per cent on an annual basis to $710,410.

Both the MLS® HPI benchmarks and average prices for low-rise home types were up by double digits percentage-wise.

“Population in the GTA continues to grow. The resulting growth in households coupled with favourable economic conditions and low borrowing costs means that we remain on track for another record year for home sales. Against this backdrop, TREB will also be releasing new third-party research, and consumer and REALTOR® survey results throughout the fall and winter, with discussions focusing on foreign buying activity and issues affecting the supply of ownership housing,” said Jason Mercer, TREB’s Director of Market Analysis.


If you’re thinking of making a move and would like to know how I can help, feel free to contact me for more info.

For complete copies of TREB’s Monthly Market Watch Reports, visit my archives here.